



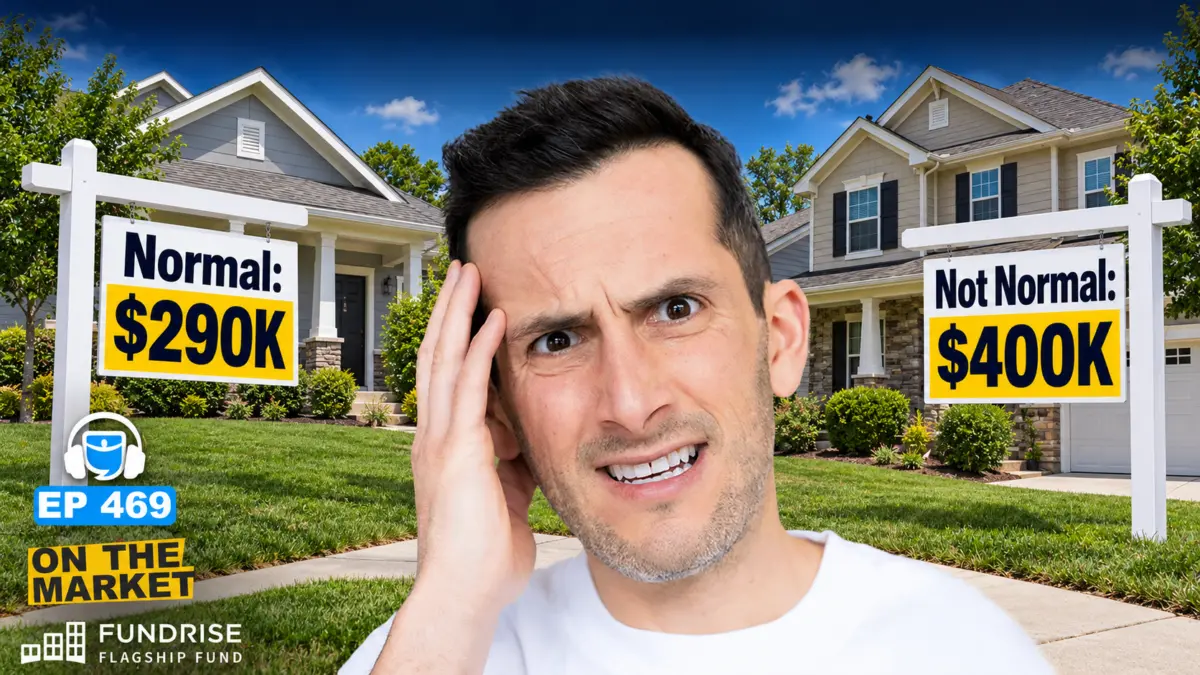
The housing market is not returning to a traditional sense of "normal" anytime soon, and according to recent economic analysis, it could take significantly longer than many industry watchers and prospective buyers anticipate. With mortgage rates hovering around 7.5% and median home prices sitting near $400,000 while wages fail to keep pace, the fundamental architecture of American real estate is under immense strain. The core question facing buyers, sellers, and investors is simple yet daunting: what will it actually take to restore housing affordability—rates, prices, incomes, or a combination of all three?
To answer this, housing analysts are looking past the emotional rhetoric of social media and turning strictly to math and historical data. By evaluating long-term trends alongside pre-pandemic baselines, experts are painting a sobering picture of how long recovery will actually take, shattering the illusion that the market is on the verge of a quick, painless rebound.
Defining "Normal" Through Historical Data
Understanding when the housing market might recover requires first defining what a normal housing market actually looks like. Analysts typically look at two primary datasets: a long-term historical average spanning from 1989 through the present, and the baseline metrics of 2019, the final full year before pandemic-fueled inflation fundamentally disrupted the broader economy and real estate sector.
Back in 2019, Americans spent roughly 15.6% of their gross income on monthly housing payments. Looking further back across a nearly 40-year historical average, the typical payment-to-income ratio sat at approximately 18.5%. These figures include periods of economic booms as well as severe downturns. By comparison, today’s average payment-to-income ratio has spiked to nearly 25%—and climbs even higher closer to 27% when factoring in peak mortgage rates.
This dramatic shift explains why the current market feels so uniquely sluggish. Since 2019, average home prices have surged roughly 63%, while family incomes have grown by only about 37%. When paired with elevated mortgage rates, monthly housing payments have more than doubled—surging by 116%—while incomes have only grown by a third.
The Three Levers of Affordability
Housing affordability is governed by three distinct components: home prices, mortgage rates, and real wage growth. To understand how the market might eventually correct itself, analysts must examine each lever independently while holding the others constant, revealing just how difficult it is to engineer a swift recovery.
The first and most socially desirable lever is wage growth. In an ideal scenario, mortgage rates and home prices would remain flat while a dramatic surge in workers’ earnings restores purchasing power. However, historical data shows how unrealistic this expectation is. To return to the 40-year historical affordability average of 18.5%, real inflation-adjusted wages would need to jump by 33%. To return to 2019 affordability levels, wages would need to skyrocket by 57%.
Historical trends show that real median wage growth has averaged a mere 0.8% annually since the late 1960s. At that historical pace, it would take nearly 40 years of sustained wage growth to reach the long-term affordability average, and roughly 59 years to return to 2019 levels. Furthermore, with real wage growth currently turning negative due to persistent inflation and technological shifts like artificial intelligence threatening high-paying positions, wage growth alone cannot solve the housing crisis.
The second lever is mortgage rates, a point of constant speculation among buyers hoping for relief. However, the math behind borrowing costs reveals a harsh reality. To achieve 2019 affordability levels under current home prices and wages, mortgage rates would need to fall to an astonishing 2.7%. Even to reach the long-term historical average, rates would need to drop to 4%.
While a return to 4% mortgage rates is technically possible over a long time horizon, it would likely require severe economic turbulence or a dramatic drop in inflation well below the Federal Reserve’s 2% target. Without such extreme economic shifts, expecting rates to plummet back toward pandemic-era lows ignores the fundamental relationship between the bond market, inflation, and borrowing costs. At best, industry observers hope for rates to eventually settle in the mid-5% range, which still falls short of restoring historical affordability.
The Price Correction Dilemma and Market Realities
With wages and mortgage rates unlikely to provide immediate relief, attention naturally turns to the third lever: home prices. To restore historical affordability through price reductions alone, the national median home price would need to experience a staggering crash.
Returning to 2019 affordability levels would require a national price crash of roughly 36%, driving the median home price down from its current perch near $446,000 to around $284,000. To reach the long-term average, prices would need to drop by 25%, bringing the median price down to approximately $335,000.
For context, the most severe price correction in modern U.S. history occurred during the Great Financial Crisis of 2007–2008, when national home prices fell by roughly 20% to 22%. That historical downturn was driven by widespread financial distress, predatory lending, and a massive surplus of forced sellers who were underwater on their mortgages.
Today’s market conditions are fundamentally different. The prevailing "lock-in effect" acts as a powerful shock absorber for home prices. Approximately 80% of existing mortgages feature interest rates below 6%, half are below 4%, and roughly 20% are below 3%. This unprecedented financial incentive prevents current homeowners from selling unless forced by major life events, keeping inventory constrained and preventing the flood of distressed properties necessary to trigger a national price crash. Delinquency rates remain remarkably low, and while regional corrections are underway in overbuilt Sunbelt markets like parts of Florida and Texas, a sweeping national price collapse remains unlikely.
Navigating a Prolonged Recovery Period
Because no single lever can fix the housing market in isolation, recovery will depend on a slow, multi-year combination of modest wage growth, gradual price adjustments, and incremental drops in mortgage rates. Economic modeling suggests that even under a balanced base-case scenario—where rates drift down to 6%, prices remain relatively flat, and wages outpace inflation slightly—it could take up to seven years for the housing market to return to traditional affordability metrics.
For real estate professionals, agents, and loan officers, this prolonged period of restrained transaction volume presents a significant challenge. Without a sudden return to high affordability, transaction activity will likely remain muted.
For real estate investors, however, the environment shifts the playbook toward disciplined purchasing. Because broad market appreciation is expected to remain low or flat in real terms over the coming years, investors can no longer rely on rising tides to lift all boats. Success in this market requires securing deep discounts below current market comparables or executing value-add strategies to manufacture equity at the point of purchase.
While the data points toward a protracted recovery rather than an overnight turnaround, understanding the hard math of affordability allows buyers, sellers, and investors to set realistic expectations, manage risk, and navigate the modern housing landscape with clear eyes.