





Financial markets are rarely a straightforward continuation of the previous day’s script, and current trading sessions are proving that rule once again. The foreign exchange and precious metals arenas are experiencing a sharp divergence in momentum, as aggressive dollar buying collides with mounting downward pressure on gold. At first glance, the narrative playing out across trading desks appears unambiguous: greenback bulls are seizing absolute control while gold bears are successfully dismantling recent bullish setups.
However, a deeper dive into multi-timeframe technical analysis reveals a more complex picture. While the U.S. dollar is storming through significant weekly and daily resistance levels, it is rapidly approaching formidable multi-year and monthly barriers. Simultaneously, gold is retreating toward a major weekly support zone and an important historical gap, setting up a high-stakes test that could ultimately challenge the longevity of the current moves. Far from a simple trend continuation, the market is approaching a critical juncture where initial price action may lay the groundwork for a broader reversal.
U.S. Dollar (DX.F): The Bulls Break Through, But Where Could They Stop?
The resilience of the dollar bears has officially been tested and found wanting. Following an unsuccessful attempt in the prior session to sustain a breakout above a crucial orange consolidation zone, dollar bulls have returned to the market with renewed force, bringing undeniable technical momentum to their positions.
On the daily chart, the shift in market dynamics is stark. Buyers have successfully pushed the greenback back above the upper boundary of the consolidation range at 102.27, while simultaneously erasing the bearish gap left behind in yesterday’s session, which spanned the 102.33 to 102.37 range. This decisive price action marks a meaningful development for short-term sentiment. The breakout from the consolidation pattern solidifies the case for an extended upward trajectory, with standard technical projections pointing to a minimum upside target of 102.87 based on the height of the formation. Current market behavior indicates that buyers are pressing this advantage with minimal hesitation.

The Weekly Chart Changes the Perspective
To fully understand the significance of the dollar’s advance, market participants must look beyond intraday and daily charts to examine the weekly perspective. The barrier that previously kept buyers in check was not merely a random horizontal line on a screen.
The resistance zone clustering around 102.36 to 102.49 represented a convergence of formidable technical obstacles, including key Fibonacci retracement levels alongside the descending upper boundary of a prominent weekly wedge pattern. In the current session, buyers have managed to breach both the wedge’s upper boundary and the combined 38.2% and 50% Fibonacci retracement hurdles.
In technical analysis, breaking through multiple major resistance barriers in a single push significantly reinforces the bullish thesis. It opens the door for a continuation toward subsequent Fibonacci resistance clusters on the weekly timeframe. Nevertheless, technical analysts note that persistent negative divergences remain visible across momentum indicators. While these divergences do not serve as automatic reversal signals, they act as important warning flags that demand close monitoring, even as buyers aggressively challenge them.
Furthermore, a closer examination of the weekly chart reveals that the dollar has already completed a measured upward move roughly equivalent in size to a preceding advance. This milestone does not signal an immediate end to the rally, but it does invite caution regarding whether the current acceleration might soon invite a corrective pullback.

Could 102.87 to 102.96 Become the Next Turning Point?
A fascinating alignment of technical indicators emerges when comparing signals across different timeframes. On the monthly chart, the dollar is steadily ascending toward the upper boundary of a broader rising wedge formation, which currently sits near 102.96. When this figure is placed side-by-side with the minimum upside objective derived from the daily consolidation pattern at 102.87, a remarkable convergence appears.
Two distinct technical measurements, calculated from entirely different timeframes, are pointing toward virtually the same localized target zone. This raises a compelling question for traders and analysts alike: could an upcoming push toward the 102.87 to 102.96 range trigger a healthy market correction rather than an immediate, unchecked continuation higher?
Such a scenario remains entirely plausible. The dollar could complete its projected daily move, absorb selling pressure at the monthly wedge resistance, and subsequently retreat to retest and verify previously broken resistance levels. A textbook retest of this nature would not automatically invalidate the broader bullish outlook; in fact, a successful defense of those old barriers could establish a solid foundation for the next leg higher. Conversely, a sharp rejection followed by a sustained breakdown beneath those broken levels would paint a much more vulnerable picture for the currency. If buyers manage to decisively break through the monthly wedge’s upper boundary, however, focus will swiftly shift toward higher weekly Fibonacci resistance levels.
Gold (GC.F): The Bullish Setup Is Under Fire, But There Is a Twist
While dollar bulls celebrate their technical breakthroughs, participants in the precious metals market are enduring a decidedly more challenging session. The bullish framework that has supported gold in recent weeks is facing its sternest test yet.

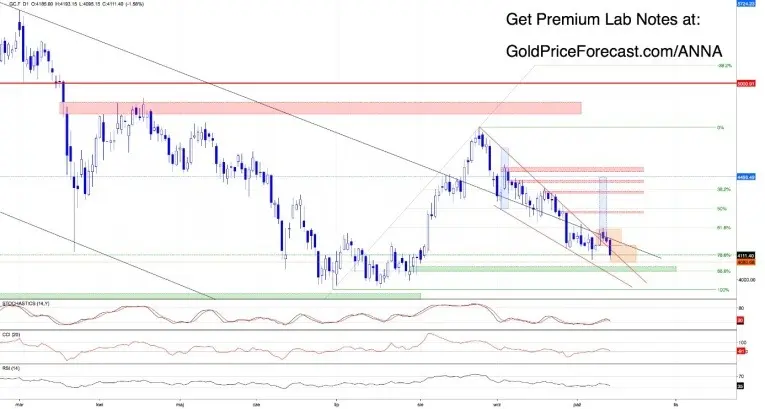
In previous market reviews, analysts highlighted the 4156 price level as a critical threshold capable of shifting the broader technical landscape. A daily close beneath this marker would not only invalidate the earlier breakout above a red falling wedge pattern but would also confirm a breakdown below the broader orange consolidation zone spanning 4156 to 4233.
The latest session’s selling pressure has successfully pushed gold beneath that vital boundary. By breaching this floor, sellers are directly challenging the technical conditions essential to maintaining the recent bullish outlook, forcing market participants to take the threat of further downside seriously.
What Does the Daily Breakdown Suggest?
If sellers manage to maintain their momentum and formally confirm the daily breakdown, standard technical projections based on the height of the orange consolidation point toward an immediate downside target of 4080.
Achieving this target would carry additional structural implications for the metal. A drop to 4080 would push gold below the previous week’s low of 4091, resulting in a fresh low rather than forming the classic double-bottom reversal pattern that many market bulls had anticipated. Yet, even as the daily chart flashes warning signs, the weekly chart introduces a layer of complexity that prevents a purely one-sided interpretation.

The Weekly Chart Tells Another Story
A closer look at the weekly timeframe highlights a significant bullish gap resting in the 4098 to 4135 range. This established support area now lies directly in the path of the ongoing market decline, creating an intriguing technical battleground.
Should sellers extend the downward movement, breach the prior low at 4091, and puncture the lower boundary of the weekly gap at 4098, it would not automatically mean that the broader bullish campaign is completely lost. Technical trading often dictates that the most revealing signal is not the initial breakdown itself, but rather how the market behaves in the immediate aftermath of that break.
Consider a scenario where sellers temporarily extend the decline to carve out a fresh low, only for aggressive buyers to step in and reclaim the weekly gap before the weekly close. Under a closing-confirmation methodology, an intraday dip below 4098 would fail to confirm a definitive weekly breakdown of that vital support structure. If gold manages to finish the week comfortably back above 4135, it would signal that sellers were ultimately unable to assert sustained control despite successfully forcing prices through immediate support levels. Such price action could lay the groundwork for a robust corrective rebound.
At the same time, an alternative outcome remains equally possible. Should gold settle the week below 4098, the breakdown of the weekly support zone would receive full technical confirmation, exposing the market to deeper selling pressure and leaving any subsequent recovery efforts with significant ground to cover.

Beyond Gold: Pressure Across the Precious Metals Complex
Gold is far from the only commodity facing intense technical scrutiny during the current market moves. Across the broader metals sector, related assets are grappling with critical boundaries of their own. Silver has slipped below major technical support levels, industrial metals like platinum and palladium are steadily approaching sensitive downside thresholds, and copper buyers have once again stumbled in their attempts to push past familiar overhead resistance.
Ultimately, today’s sharp moves by dollar bulls and gold bears demonstrate that aggressive short-term price action does not inherently make subsequent market phases predictable. The greenback is rapidly closing in on a technical convergence zone where resistance could provoke a meaningful reaction, while gold is locked in a pivotal test of major weekly support that will dictate whether its recent weakness develops into a lasting trend. By remaining objective and following the evolving technical roadmap, market participants can better navigate the shift between immediate price noise and underlying structural developments.