




In a recent Money Metals podcast interview, market analyst Mike Maharrey sat down with veteran technical analyst Clive Maund to examine the turbulent state of the global financial landscape. The wide-ranging conversation addressed the heavy pressures currently facing the Treasury market, soaring government debt levels, fluctuating oil prices, and persistent inflation. Against a backdrop of an increasingly unstable fiat monetary system, the two analysts explored how these macroeconomic forces are impacting precious metals and what technical charts reveal about the road ahead for gold and silver.
Clive Maund has spent decades analyzing global markets and has operated his independent financial website, CliveMaund.com, since 2003. His analytical work concentrates heavily on the resource sector, encompassing precious metals, mining equities, copper, crude oil, natural gas, and broader financial markets. Unlike many market observers who begin their research with fundamental economic data or corporate earnings reports, Maund relies primarily on technical analysis. He views market charts as a comprehensive, visual record of supply and demand dynamics, underlying price action, prevailing market psychology, and the critical interaction between price movements and time.
As he explained to Maharrey, the exact dollar magnitude of a price change is often less significant than the proportional ratio. A financial asset moving from $1 to $2, from $2 to $4, or from $4 to $8 has achieved the exact same 100 percent gain in each instance. Charts provide investors with a reliable method to visualize those proportional shifts and identify major trends, historical cycles, consolidation bases, breakout points, and topping formations.
Treasury Yields Are Pressuring Gold
The discussion kicked off with an analysis of the U.S. Treasury market and the direct impact that rising sovereign yields are exerting on gold and silver prices. Maharrey pointed out that yields on both the 10-year and 30-year U.S. Treasury notes have climbed to levels not witnessed since 2002, creating significant headwinds and volatility across broader financial markets.
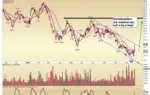
Maund shared a one-year chart tracking the 10-year Treasury yield, noting that yields have maintained a relatively steady uptrend since March. However, his chart analysis also showed that yields had reached the upper boundary of that established uptrend channel. Furthermore, the Moving Average Convergence Divergence (MACD) indicator, which Maund routinely employs to gauge market momentum and evaluate overbought or oversold conditions, strongly suggested that yields had become extremely overbought.
While Maund cautioned that an overbought reading does not guarantee an immediate market reversal—as financial markets frequently remain overbought longer than market participants anticipate—the chart nonetheless indicated that a consolidation phase or a corrective pullback in yields is becoming increasingly probable.
Such a pullback in yields could carry profound implications for the precious metals sector. Maund observed that the recent downward correction in gold prices was driven in substantial part by rising Treasury yields and the corresponding strength in the U.S. dollar. If yields begin to retreat from their current highs, that downward pressure could quickly dissipate, allowing both gold and silver to recover their upside momentum.
Maharrey acknowledged that rising yields have weighed heavily on precious metals in the short term, but he questioned the wisdom of abandoning a proven inflation hedge simply because government bond yields are climbing within an economic environment defined by massive debt accumulation, monetary expansion, and mounting systemic uncertainty.
Maund responded that current market conditions could eventually mirror the late 1970s, a period when gold appreciated concurrently with rising yields due to the broader inflationary implications of the macroeconomic environment. In such a scenario, investors predictably seek hard assets and real money, even if government bond yields remain elevated.
Debt Saturation and a Treasury Market Under Strain
Transitioning from short-term charts to structural economic realities, Maund argued that the far greater concern is not any isolated chart pattern, but rather decades of unchecked government borrowing and aggressive money creation. Governments across the globe, he noted, have continually kicked the structural debt can down the road by deploying artificially low interest rates, quantitative easing programs, and ever-larger fiscal deficits.
In the United States, the national debt has ballooned to roughly $40 trillion, with Maund estimating that the annual cost of servicing that staggering debt load now sits at approximately $1 trillion. He described the present economic juncture as a state of debt saturation, where the sheer financial burden of funding government obligations has grown so immense that the market increasingly demands higher yields in exchange for holding government debt instruments.
In Maund’s estimation, policymakers are boxed in with severely limited options. They can permit bond yields to continue rising, which risks unleashing severe financial stress across the Treasury market, equity exchanges, and broader credit markets. Alternatively, they can authorize the creation of more fiat money to actively support government debt issuance and suppress yields, a move that would further erode the purchasing power of the national currency.
He emphasized that ongoing money creation allows governments and large financial institutions to temporarily delay their day of reckoning, but everyday citizens ultimately bear the cost through inflation. As additional currency units are brought into existence, the purchasing power of each existing dollar steadily diminishes, driving up the cost of living as new money filters through the broader economy.
Maharrey highlighted that the largest buyers within the Treasury market increasingly appear to be hedge funds operating with high levels of leverage. Maund agreed, noting that this dynamic only reinforces the underlying fragility of a financial system where mountains of sovereign debt must be perpetually refinanced at progressively higher borrowing costs.
Both analysts stressed that the core issue extends far beyond the price performance of a single Treasury security; rather, it is the profound structural dependence of the entire financial system on expanding debt, expanding credit, and the enduring willingness of investors to accept promises payable in depreciating fiat currency.
Gold’s Short-Term Setup and Long-Term Case
Turning his focus specifically to gold, Maund noted that a three-month chart revealed a small head-and-shoulders topping pattern. He had previously cautioned market participants that this specific technical formation carried the potential to trigger a short-term price pullback.
However, he was careful to emphasize that the formation did not exhibit the characteristics of a major long-term top. Because it is a relatively small pattern, its technical implications are strictly limited to the short and medium term. When viewed on longer-term charts, this exact price move may simply represent a routine consolidation phase within a much larger, overarching bullish structure.
Maund suggested that gold prices may be reacting back toward the upper boundary of a bullish falling-wedge pattern, identifying the $3,900 to $3,950 per ounce range as a potential zone of robust technical support. Should gold retrace into that specific price band, Maund noted it could present a technically attractive accumulation opportunity for buyers. Alternatively, gold might reverse its direction and head upward before testing those lower levels if bond yields begin to recede or if energy prices moderate.
In that scenario, Maund advised traders to closely monitor whether gold can successfully break back above a former support level that has since transformed into overhead resistance following the head-and-shoulders breakdown. A decisive, high-volume move above that barrier would signal that gold is fully prepared to resume its primary upward trend.
Maharrey added that geopolitical tensions, such as the ongoing conflict involving Iran and the resulting upward pressure on oil prices, have acted as a temporary ceiling on precious metals. Concerns regarding the Strait of Hormuz, elevated energy costs, stubborn inflation readings, and rising yields have collectively fostered a challenging short-term trading environment for both gold and silver.
Nevertheless, both analysts agreed that these macroeconomic headwinds are cyclical and could reverse course. If oil prices begin to ease and Treasury yields retreat from their overbought extremes, the combined macroeconomic and technical backdrop for precious metals could experience a rapid and powerful improvement.
Oil Prices and the Political Calendar
Continuing the discussion on commodities, Maund examined a one-year chart for Brent crude oil, pointing out that it appeared to be forming a potential double top—a classic technical pattern that frequently signals a forthcoming price decline following an extended advance.
He suggested that crude oil prices could experience a downward correction in the coming weeks, particularly if political leaders pursue conciliatory diplomatic measures regarding Iran ahead of the midterm elections in November. Maund carefully framed this observation as a conditional possibility driven by obvious market and political incentives rather than offering it as an absolute prediction.
Lower energy prices would undoubtedly serve as a welcome relief politically, as high fuel costs feed directly into public frustration and exacerbate broader inflation metrics. Furthermore, a decline in oil prices could alleviate upward pressure on both Treasury yields and the U.S. dollar.
This dynamic holds significant relevance for the precious metals complex, given that the recent correction in gold and silver prices unfolded concurrently with surging oil markets and rising yields. A reversal in those dominant trends could effectively remove a major roadblock standing in the way of the next sustained advance in precious metals.
Silver’s Enormous 45-Year Pattern
Undoubtedly the most bullish segment of the interview centered on the outlook for silver. Maund presented a long-term silver chart featuring what he described as an extraordinarily massive cup-and-handle formation spanning approximately 45 years of historical price data.
He remarked that in decades of conducting rigorous chart analysis, he has rarely encountered a formation so clear and of such immense historical scale. Maund initially highlighted this rare technical setup last year, just prior to silver breaking out decisively and surging toward approximately $120 per ounce.
The subsequent price decline, he explained, should not be misconstrued as a failure of the long-term breakout. It is entirely normal market behavior for assets to experience a post-breakout reaction and retest phase, particularly following such a sharp and aggressive advance from a foundational base.
According to Maund, silver has been retracing toward historical support near the upper boundary of the giant cup-and-handle pattern—a textbook technical retest following a major breakout. While he allowed that silver could drift somewhat lower in the immediate term, potentially testing the $50 to $55 per ounce region, he characterized the broader $50 to $60 price band as an exceptionally strong long-term buying zone.
Ultimately, Maund asserted that the long-term chart points toward substantially higher silver valuations in the months and years ahead. He strongly advised investors holding physical silver to look past day-to-day market volatility and maintain their focus on the overarching macro trend, which he believes remains profoundly bullish.
Maharrey concurred, noting that prevailing macroeconomic fundamentals fully support that technical assessment. Silver markets have grappled with persistent structural supply deficits for years, and notable physical demand pressures have recently surfaced across both the COMEX and London bullion markets. Those fundamental realities, when paired with such a powerful technical setup, could create an explosive environment for silver if physical demand continues to outpace available mine supply.
Real Money in an Era of Currency Debasement
The conversation concluded with a broader philosophical and economic discussion regarding why gold and silver continue to hold enduring relevance in the modern financial architecture. Maund emphasized that physical precious metals differ fundamentally from government bonds, paper fiat currencies, and digital financial instruments because they cannot be conjured into existence with the simple stroke of a keyboard.
While central banks and governments possess the unchecked authority to expand supplies of fiat money and credit at will, they cannot print physical gold or silver. That immutable physical constraint is precisely why precious metals have served as reliable money and trusted stores of value for thousands of years of human history.
Maharrey reiterated that the mission of Money Metals is to help everyday individuals comprehend how ongoing currency debasement steadily erodes their hard-earned purchasing power, and how holding physical gold and silver can provide a reliable shield against that erosion. Neither analyst portrayed precious metals as an effortless or flawless panacea, but both maintained that tangible assets offer a vital, independent alternative to an increasingly debt-dependent fiat monetary regime.
For Clive Maund, the ultimate value of analyzing gold and silver extends far beyond mere short-term price forecasting. In times of profound economic uncertainty and systemic darkness, he noted, a clear understanding of real money can provide people with a practical roadmap and a renewed sense of financial security.