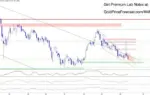






The precious metals sector is navigating a delicate technical juncture as market observers digest the latest signals from established quantitative models. According to the latest technical assessment from market analysts, the proprietary cycle indicator tracking the gold sector has officially turned downward, signaling a shift in short-term momentum across bullion and related mining equities. While long-term structural trends for gold and its mining equities remain pointed upward, current price action suggests that a deeper correction or consolidation phase is actively underway.

For market participants, the transition of the cycle indicator into negative territory serves as a critical tactical pivot. The indicator, which is widely utilized by traders and investors as a timing mechanism, is designed to navigate market fluctuations by identifying optimal entry and exit windows. While analysts note that the tool is not infallible—acknowledging that heightened market volatility can occasionally induce short-term whipsaws—it historically offers a reliable framework for determining directional speculation within the commodities space.

In light of the current downward cycle reading, strategic guidance for investors emphasizes capital preservation and risk mitigation. Long-term investors are generally advised to remain in cash or maintain hedged positions until the broader market cycle realigns to the upside. Conversely, active traders who operate on shorter time horizons are encouraged to adhere to disciplined execution strategies, specifically entering positions near confirmed cycle bottoms and liquidating holdings at cycle tops to capture incremental profits during periods of oscillation.

The bearish short-term momentum is reinforced by a synchronized cluster of sell signals across major gold-backed exchange-traded funds and equity indexes. Specifically, the SPDR Gold Shares (GLD) has registered a short-term sell signal, reflecting immediate downward pressure on physical bullion prices. A parallel development has emerged within the equity space, where the VanEck Gold Miners ETF (GDX), the Junior Gold Miners ETF (GDXJ), and Canada’s prominent Global Gold Index (XGD.to) have all triggered short-term sell signals. These technical readings collectively highlight a broad-based cooling-off period following previous recovery attempts across the sector.

A granular look at the underlying charts provides further context regarding the mechanics of the current market correction. Broader speculation models continue to point toward lower overarching gold prices in the immediate term, even as foundational trends maintain a resilient upward posture. Detailed analysis of the primary charts reveals that while the multi-period trend for physical gold remains pointed upward, prices are currently descending to test crucial support levels. A similar structural resilience is visible in the broader trend for gold mining equities, which also retains an upward trajectory despite the prevailing short-term headwinds.

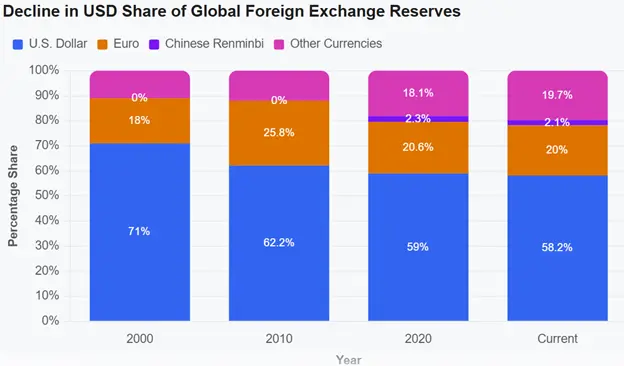
Concurrently, the strengthening performance of the United States Dollar (USD) continues to exert external pressure on dollar-denominated commodities. The technical trend for the greenback remains firmly upward, creating a familiar macroeconomic challenge for bullion prices as currency strength dampens immediate speculative demand. Further complicating the technical landscape, key intermarket ratios governing the sector have flashed sell signals, while recovery rallies in gold mining equities have faced decisive rejection at established overhead resistance levels.

Despite these near-term corrective pressures, longer-term technical formations continue to offer glimpses of underlying market structure. Analysts tracking chart patterns have identified a potential inverted head and shoulders formation in progress, a classic technical configuration that, if eventually completed and confirmed, could signal a major bullish reversal over a longer time horizon. However, the immediate reality remains dictated by the rejection of recent recovery rallies at resistance zones and the ongoing digestion of previous gains.

In summary, the current technical landscape for the gold sector is characterized by a conflict between prevailing long-term upward trends and a decisive short-term correction. With the sector cycle indicator pointing downward, recovery rallies having stalled at resistance, and both physical gold and mining equities displaying short-term sell signals alongside a strengthening U.S. dollar, market participants are being forced to navigate a transitional phase. Analysts emphasize that the observations and signals derived from these trading models are intended to provide objective technical frameworks rather than definitive market predictions. As always, market participants are advised to exercise independent discretion and manage risk according to their individual investment mandates and time horizons.