




The Tax Foundation has officially rebranded and completely overhauled its long-running annual study, transitioning the State Business Tax Climate Index—published since 2003—into the State Tax Competitiveness Index for its upcoming edition. According to Katherine Loughead, Vice President of State Policy at the Tax Foundation, the new title is designed to better reflect what the publication actually assesses: a state’s overall tax competitiveness, rather than its narrow business tax climate alone.
This transformation was not merely a cosmetic change. The organization rebuilt the index from the ground up to address an accelerating pace of change in state and federal tax codes. Over the past two decades, the index has served as a roadmap for policymakers evaluating their tax systems. However, recent disruptions have transformed the tax landscape. The adoption of the federal Tax Cuts and Jobs Act, the Supreme Court’s Wayfair decision regarding remote sales, the rise of remote work following the global pandemic, roiling unemployment insurance regimes, new digital advertising levies, and emerging state-level interest in wealth taxes, unrealized gains, data taxes, and digital products necessitated a more comprehensive evaluation framework.
The Tax Foundation noted that while independent evaluations consistently demonstrated a strong correlation between past index ranks and state economic outcomes, a ground-up refresh was necessary before the publication grew stale. The updated methodology incorporates more than 150 variables—hidden away in previous appendix tables—into a reimagined digital environment. Each state now receives a dedicated summary highlighting notable tax code features, explanations for its rank, and specific reforms that could improve its tax competitiveness. Furthermore, users now have access to interactive, sortable, and filterable datasets alongside historical rate tools.
To ensure transparency and maintain an apples-to-apples comparison, the Tax Foundation has backcast state rankings under the new methodology going back seven years. While some states have experienced noticeable shifts in their rankings due to recent legislative activity, these backcast metrics represent the controlling rankings that should be cited to track actual movement over time.
Understanding the Index and Tax Competition
In public finance, tax competition can be viewed much like Wins Above Replacement (WAR) in baseball—a metric designed to measure how much value a specific player adds over a replacement-level alternative. Similarly, a well-structured tax code will not instantly transform a sparsely populated region into a bustling metropolis, nor will a poor tax structure turn a major financial center into a ghost town. Yet, tax structure plays a substantial role in a state’s economic successes or failures. Every state can benefit from a simple, neutral, transparent, and pro-growth tax structure.
The index evaluates states across five subindices representing major components of state tax codes: corporate taxes, individual income taxes, sales and excise taxes, property and wealth taxes, and unemployment insurance taxes. Rather than weighting each subindex equally, their respective weights are determined by the statistical variance across states within each category. This assigns heavier weight to areas where states possess greater opportunities to compete.
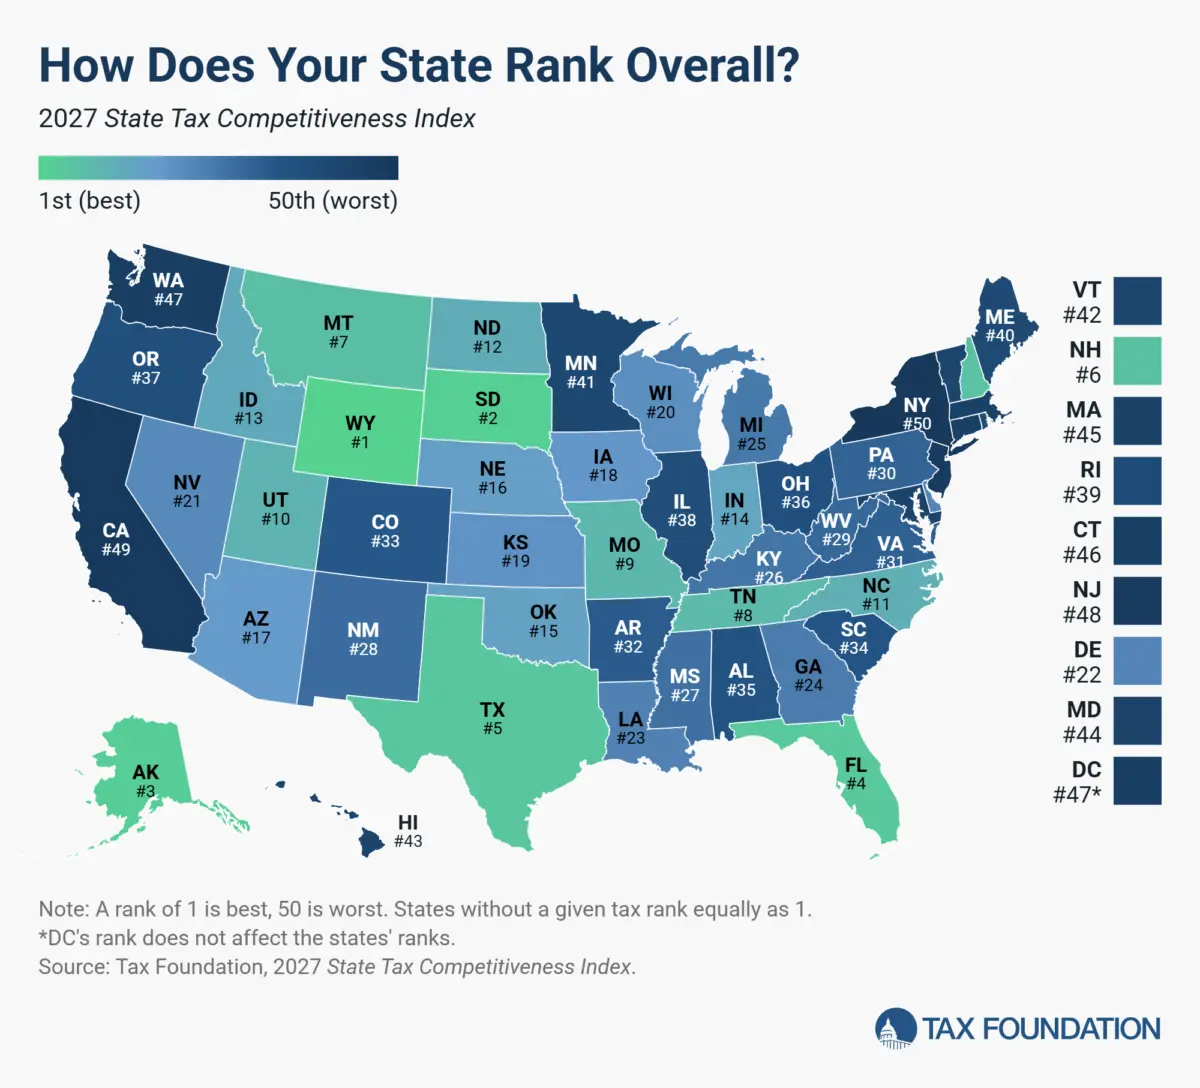
States that forgo a major tax entirely—such as individual income, corporate income, or sales taxes—often secure high scores on specific subindices. For example, South Dakota and Wyoming levy neither corporate nor individual income taxes, helping propel them to top positions. However, top-tier performance is not exclusive to states lacking major taxes. Jurisdictions like Missouri, Utah, and North Carolina successfully impose all major tax types while maintaining moderate rates and well-designed tax structures that rank them among the highest performers overall.
Top and Bottom Performers in the New Index
The absence of a major tax remains a common thread among many of the top-ranked states. Wyoming and South Dakota lead the pack due to their lack of corporate and individual income taxes. Alaska and New Hampshire levy no individual income or state-level sales taxes, while Florida, Tennessee, and Texas impose no individual income tax, and Montana maintains no sales tax. Meanwhile, states occupying the lowest rankings on the index share common characteristics: complex, nonneutral tax systems with comparatively high rates. New Jersey, for instance, struggles with some of the nation’s highest property tax burdens, the highest-rate corporate income tax in the country, a high individual income tax rate, an inheritance tax, and poorly structured individual income provisions.
Notable Legislative Shifts Across States
States across the country have been exceptionally active in modifying their tax structures, leading to notable shifts in this year’s index. Arizona fell three spots to 17th overall, hampered by the timing of retroactive conformity legislation and a three-year moratorium on tax incentives for new data center projects. Arkansas dropped three spots to 32nd, driven largely by ongoing nonconformity with federal full expensing allowances under Section 168(k).
Georgia fell from 18th to 24th due to a reduction in its corporate income tax score, as it declined to conform to competitive corporate expensing provisions and narrowed its individual income tax base by partially exempting tips and overtime pay. Idaho slid four places to 13th, primarily because it conformed to temporary individual deductions for tips and overtime, which costs substantial revenue without generating equivalent economic growth. Indiana dropped three spots to 14th as high local income tax add-ons and deductions for tips and overtime weighed down its individual income tax ranking.
Conversely, Kansas improved four places to 19th, driven by rolling conformity to pro-growth business expensing provisions. Louisiana jumped from 32nd to 23rd, propelled by a 17-place improvement in its property tax rank following the elimination of its damaging capital stock tax and the extension of S corporation filing options. Missouri broke into the top 10, rising from 12th to 9th by conforming to increased business expensing provisions while resisting base-narrowing exemptions for tipped and overtime income. Nebraska climbed eight places to 24th to 16th, fueled by continuous reductions in its flat individual and corporate income tax rates down to 4.55 percent. Utah advanced five places to 10th by embracing pro-growth federal expensing provisions and trimming income tax rates to 4.45 percent.
The Broader Economic Impact of State Taxation
The modern market is characterized by highly mobile capital and labor. Businesses of all sizes naturally gravitate toward locations offering the greatest competitive advantage. Empirical evidence demonstrates that states with superior tax systems are more effective at attracting new businesses and generating employment growth. While companies weigh numerous factors—such as raw material access, infrastructure, and skilled labor pools—a streamlined tax system can positively impact overall business operations. Furthermore, unlike healthcare or educational overhauls that require decades to implement, tax code reforms can swiftly enhance a state’s competitive edge.
Historical and contemporary economic literature increasingly supports the consensus that taxes significantly influence business decisions and location choices. Early research by Charles Tiebout introduced the concept of individuals "voting with their feet" based on public goods and tax levels. Over subsequent decades, extensive empirical research by economists like Timothy J. Bartik, Robert Helms, and others established that state and local taxes exert a measurable, negative impact on business start-ups, employment growth, and capital investments. Property taxes, because they are levied regardless of profits, often impose the harshest burdens on young, growing enterprises.
Ultimately, state lawmakers operate in an environment of intense regional competition. Most job relocations occur between U.S. states rather than internationally, meaning state leaders must remain acutely aware of how their business climates match up against immediate neighbors and regional competitors. By utilizing the State Tax Competitiveness Index as a diagnostic tool, policymakers can identify structural weaknesses, eliminate economic distortions, and position their states for sustainable long-term economic growth.