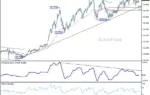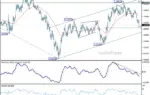




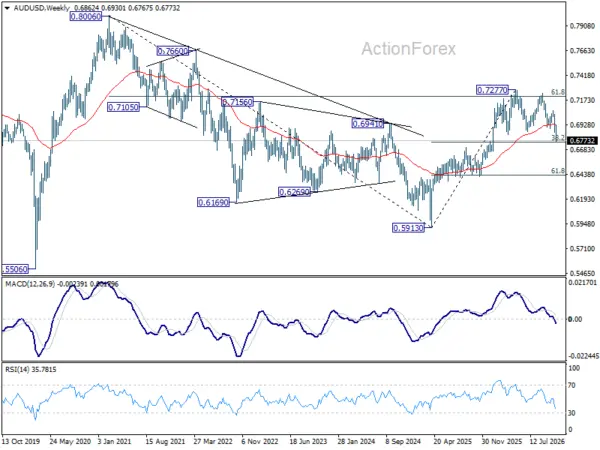
The Australian Dollar continues to experience downward pressure against its US counterpart, extending its corrective decline from the medium-term peak of 0.7237 established in recent weeks. Market participants maintaining short-term positions are closely monitoring incoming price action, with initial technical bias remaining firmly on the downside as the currency pair approaches critical Fibonacci support zones.

Entering the new trading week, the primary objective for bearish momentum rests at the 0.6756 Fibonacci retracement level. A decisive, firm break beneath this threshold would expose the pair to deeper retracements, opening the door toward the 100% projection target calculated from the significant swing of 0.7237 down to 0.6893, projected from the 0.7067 secondary peak. This calculation maps out a potential slide toward the 0.6723 region. Conversely, any intraday recovery attempts face immediate hurdles, with a push above the 0.6853 minor resistance level required to neutralize the current downward intraday bias and trigger a period of consolidation.
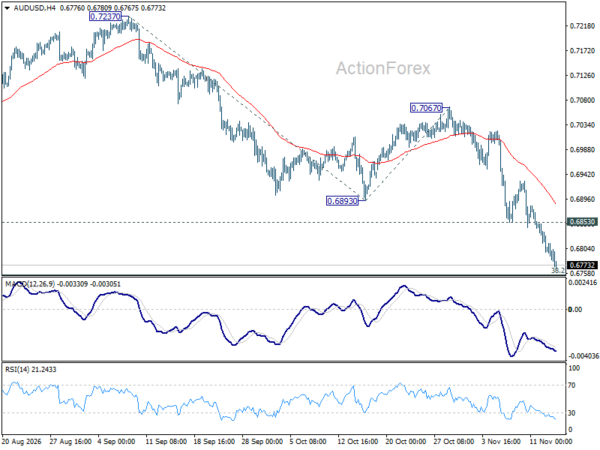
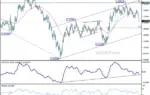
Zooming out to examine the broader technical landscape, the recent price action unfolding from the 0.7277 medium-term top is widely interpreted by market analysts as a developing corrective phase rather than the inception of a primary trend reversal. This correction follows a notable preceding bullish leg that originated from the 0.5913 multi-year low. While market watchers acknowledge that a deeper pullback cannot be entirely ruled out given the current selling velocity, broader structural theories suggest that downside momentum should ultimately find a floor. Specifically, the 38.2% retracement level of the broader advance from 0.5913 to 0.7277 sits squarely at 0.6756, a convergence that is expected to attract fresh buying interest and spark a meaningful technical rebound.
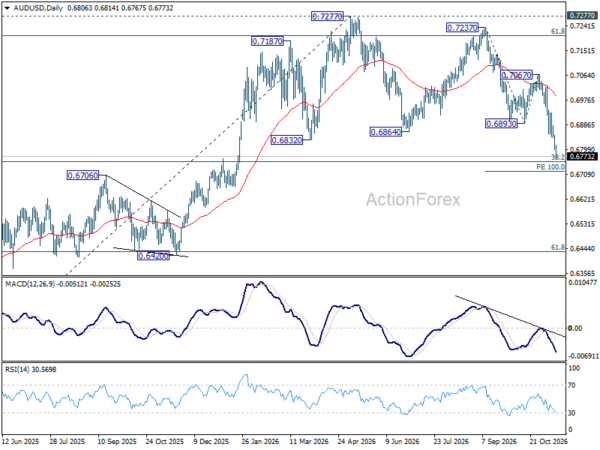
Market conditions are thus anticipated to remain range-bound or consolidative below the 0.7277 ceiling over the near term as the currency pair digests previous gains, paving the way for an eventual structural upside breakout further down the line. However, caution remains warranted among bullish traders; a sustained, confirmed break beneath the crucial 0.6756 support zone would significantly elevate the risk profile, shifting probabilities toward a larger-scale bearish reversal that could fundamentally alter the medium-term outlook.
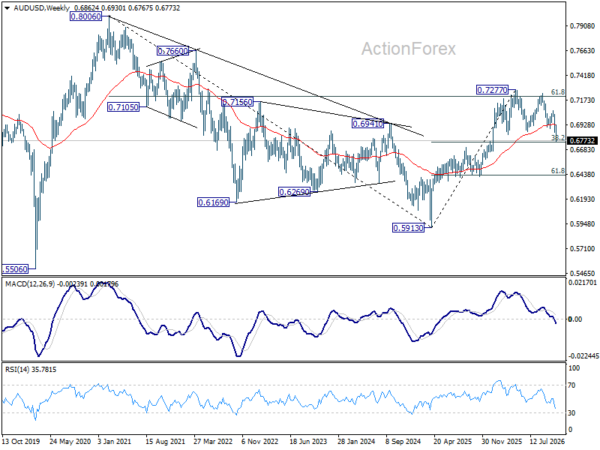
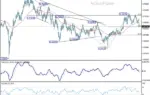
A wider historical perspective on the AUD/USD weekly charts reveals that the robust upward trajectory originating from the 0.5913 swing low functions structurally as the third leg of a much larger corrective or impulsive pattern dating all the way back to the 2020 major cyclical low of 0.5506. While technical analysts debate whether this extensive multi-year formation ultimately classifies as a classic impulsive sequence or a complex corrective pattern, the overarching implications for long-term investors remain constructive. Regardless of the underlying wave classification subtleties, further structural appreciation is projected over the long term, with historical price targets pointing back toward the significant psychological and technical milestone of 0.8006, and potentially extending beyond that threshold.
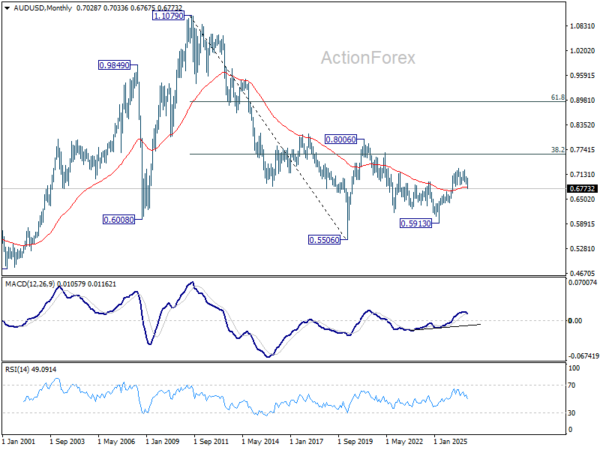
Crucially, this constructive long-term scenario relies heavily on the preservation of key moving average parameters. Market integrity for the broader bull case is heavily anchored by the 55-month Exponential Moving Average (EMA), which currently resides near the 0.6806 mark. As long as price action continues to respect and hold above this critical long-term dynamic moving average, the foundational bullish bias remains favored by institutional technical models, even as short-term traders navigate the ongoing corrective pullback toward immediate support boundaries.