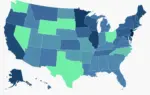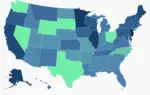






This week marks the release of the Tax Foundation’s annual State Tax Competitiveness Index, serving as a diagnostic tool designed to compare state tax structures across more than 150 distinct variables. Unlike the vast majority of studies that focus primarily on the sheer volume of taxes—examining simply how much revenue a state extracts from its populace—this comprehensive index zeroes in on the how. It operates on the foundational principle that there are inherently better and worse ways to design a tax code to raise necessary public revenue.
Inevitably, the publication of the annual rankings sparks familiar debates and pointed questions among taxpayers, business owners, and policymakers alike. Chief among them is a geographical and economic puzzle: if states like Wyoming and South Dakota routinely secure the top positions in the rankings, why aren’t corporate headquarters migrating in droves to the Black Hills or the Wyoming Basin?
To understand this phenomenon, it helps to look at tax competition through a lens borrowed from the world of sports: WAR, or Wins Above Replacement. In baseball, sabermetricians use WAR to measure how many more wins a team can claim because of a specific player compared to the baseline performance of a replacement-level player. Public finance operates much the same way. A well-structured, pro-growth tax code will not single-handedly transform a sparsely populated rural basin into a bustling global metropolis, just as a poorly structured tax system will not automatically reduce a major economic engine like Manhattan to a ghost town.
Nevertheless, tax structure does play a tangible and often substantial role in a state’s broader economic successes or failures. Every state, regardless of its geographic size or economic base, stands to benefit from a tax system defined by simplicity, neutrality, transparency, and a pro-growth architecture.
Inside the Sub-Indices and the Weight of Competitiveness
The methodology behind the Index relies on evaluating states across five distinct sub-indices. Each sub-index represents a major pillar of modern state tax codes: corporate taxes, individual income taxes, sales and excise taxes, property and wealth taxes, and unemployment insurance taxes.
Rather than defaulting to an equal weighting for each of these five areas, the Tax Foundation determines their weight based on the statistical variance observed across states within each category. This deliberate approach assigns greater weight to the policy areas where individual states have the widest berth to compete against one another.
Naturally, introducing structural flaws into the design of a tax that a government does not even levy is impossible. Consequently, states that choose to forgo major taxes entirely—such as individual income taxes, corporate income taxes, or broad-based sales taxes—tend to secure flawless or near-flawless scores on the corresponding sub-indices. This dynamic largely explains why states like Wyoming and South Dakota, neither of which imposes an individual or corporate income tax, routinely claim top spots on the overall Index.
However, this strategy comes with its own structural trade-offs. States that choose to avoid imposing one or more of these major revenue sources must balance their books through other means. They often have to lean heavily on the remaining major tax types—which can depress their rankings in those specific components—or they must choose to operate on leaner public budgets. Other states offset the absence of certain taxes by capitalizing on lucrative natural resources like oil and gas, or by benefiting from unique demographic profiles, as seen in Florida, where alternative revenue streams generate a surprising volume of public funds.
The Alternative Models: Proving Wyoming Isn’t the Only Way
While replicating the exact fiscal model of Wyoming or South Dakota may prove entirely impractical for many states given their distinct public service demands and economic landscapes, viable alternatives exist. States ranking ninth through fifteenth in this year’s Index—including Missouri, Utah, North Carolina, North Dakota, Idaho, Indiana, and Oklahoma—demonstrate that a state can successfully impose each of the major taxes while maintaining moderate rates and well-designed structures.
Many of these middle-to-high-ranking states have systematically modernized their tax codes over the past two decades. Utah initiated its comprehensive reforms back in 2006, followed by Indiana in 2011. North Carolina embarked on an ambitious string of tax overhauls beginning in 2013, while Idaho initiated significant updates in 2022 and North Dakota followed in 2023. Missouri has similarly enacted a series of targeted rate cuts and structural reforms in recent years, culminating in the scheduled repeal of its capital tax gains in 2025. Oklahoma has likewise pursued modernizing reforms, eliminating both its marriage penalty and capital stock tax in 2024, alongside scheduled reductions and bracket consolidations for individual income tax rates slated for 2026.
For ordinary taxpayers, the Index functions as a practical starting point for understanding how their home state stacks up against economic peers. For policymakers, however, it serves as an advanced diagnostic instrument. The comprehensive tables within the report enable leaders to perform granular comparisons on everything from throwback rules and the tax treatment of net operating losses to whether individual income tax brackets are properly indexed and whether the state authorizes split-roll property taxation.
Acknowledging the Limits of Tax Policy in Economic Location
If a state like South Dakota were suddenly saddled with New York’s notoriously complex tax code, its economy would likely struggle under the sudden weight. Clearly, millions of people are willing to pay a substantial premium to live, work, and operate businesses in New York—absorbing higher costs for real estate, consumer purchases, and state taxes alike.
Yet, economic limits do exist. A tax structure that remains bearable for a major corporate entity in Manhattan may prove considerably more burdensome for a small business operating in Syracuse. Moreover, as successive leaders in New York have noted during budget crises, tax burdens and structural efficiency still matter immensely, even in massive economies. In fact, New York previously achieved notable improvements in the corporate component of the Index following bipartisan adoption of meaningful corporate tax reforms.
Questions frequently arise regarding whether the data implies that businesses would universally prefer setting up shop in Mitchell, South Dakota, over Manhattan, or Sioux Falls over San Francisco. In reality, corporate location decisions are driven by a complex matrix of factors that extend far beyond tax rates or code structures.
The Index measures tax structure, not the host of other variables that heavily influence business investments, such as access to an educated workforce, overall quality of life, proximity to vital consumer markets, or prevailing regional weather patterns. Navigating these factors often involves inherent trade-offs for state leaders.
Nevertheless, tax policy remains one of the few critical levers directly within the control of policymakers. Even when operating under a fixed revenue target, governments can choose between better and worse methods for collecting that revenue. Modernizing a state’s tax structure helps position it more competitively for long-term economic growth, proving that states with better-structured tax codes consistently secure their own form of Wins Above Replacement.