




Yesterday’s market breakouts offered a strong dose of optimism for bulls across multiple asset classes, but today’s price action is rapidly replacing that enthusiasm with a series of uncomfortable questions. Financial markets are known for their sudden shifts in sentiment, and the rapid turnaround seen in both currency and industrial metal sectors highlights just how fragile recent technical achievements can be.
The U.S. dollar has quickly slipped back below its recently breached consolidation boundary, surrendering the gains it fought hard to secure just a session prior. Simultaneously, copper buyers have once again slammed into a formidable resistance area, failing to extend their rally beyond critical technical barriers. In the case of the industrial metal, this persistent inability to advance has brought a potentially bearish A-B-C correction scenario sharply into focus for market analysts.
Observers are now left weighing whether these sudden reversals represent nothing more than temporary, routine setbacks in an ongoing trend, or if they serve as early warning signs of a much more significant shift in market direction. As is so often the case in professional technical analysis, the ultimate answer may depend heavily on how prices behave around a very specific handful of key technical levels.
U.S. Dollar (DX.F): A Breakout That Lost Its Momentum
Looking closely at both the daily and weekly charts for the U.S. dollar, market participants could easily be forgiven for thinking that the bullish camp had finally pulled off a decisive victory.
Monday’s trading session delivered a fairly impressive white candlestick, pushing the greenback to a close comfortably above the upper boundary of its orange consolidation range, which spans between 101.67 and 102.27. For momentum traders and currency bulls, this looked like a textbook positive technical development—a clear signal that the dollar was ready to break out of its prolonged horizontal range and resume a broader upward trajectory.
So, the natural question echoing through trading floors is simple: why didn’t the rally continue?
The answer lies directly overhead, where a thick cluster of technical resistance proved to be an insurmountable obstacle. The key resistance zone sitting between 102.36 and 102.49 acted as a heavy traffic jam for the currency. This specific area converges two critical technical hurdles: the green rising resistance line clearly visible on the broader weekly chart, and the 100% and 127.2% Fibonacci extension levels. When combining these factors with mounting negative divergences flashing across standard momentum indicators, market bears found themselves armed with a solid, data-backed argument for pushing back against the advance.
Push back they did, and with considerable force. Tuesday’s Asian trading session opened with a notable bearish gap between 102.33 and 102.37. Sellers quickly seized this window of opportunity, aggressively driving the dollar back down and below the previously broken upper boundary of its familiar consolidation range. Suddenly, the breakout that looked so promising less than 24 hours earlier has lost its conviction, leaving traders to re-evaluate the strength of the greenback.
What Happens If the Bears Hold Their Ground?
With the immediate trend stalled, the upcoming daily close will carry extraordinary importance for the near-term fate of the currency market.
Should the U.S. dollar finish today’s trading session below the 102.27 threshold, it would officially confirm the total invalidation of yesterday’s breakout attempt above the consolidation zone. Such a failure would significantly increase the mathematical probability of further downside extensions in the sessions ahead.
On the downside, the first major area of interest combines the lower boundary of the current consolidation at 101.67 with a bullish price gap ranging from 101.60 to 101.70, which was originally established back on October 7. However, market technicians emphasize that the broader structural outlook still hinges on an even more substantial support floor. As analysts have repeatedly noted, the significant June and July highs resting between 101.49 and 101.57 remain the absolute critical support area shaping the macro technical landscape. That fundamental premise has not changed, regardless of the daily noise.

What Would Put the Bulls Back in Control?
For the bullish camp to regain command of the market, generating another fleeting intraday recovery will simply not suffice. Buyers need to demonstrate sustained commitment and structural follow-through.
A constructive first step would involve closing today’s newly formed bearish gap at 102.33-102.37. However, the far more significant achievement required to turn the tide would be a decisive daily close above the stubborn resistance zone located at 102.36-102.49. Until buyers can accomplish that feat, yesterday’s breakout remains deeply vulnerable to further selling pressure.
Ultimately, the bulls won the opening battle, but they have failed to secure the territory. Today’s closing bell will ultimately reveal whether yesterday’s move was a genuine, lasting advance or merely another failed attempt by optimists to punch through established overhead resistance.
Copper (HG.F): The Bulls Hit a Wall as an A-B-C Correction Takes Shape
If the currency markets are showing signs of exhaustion, the industrial metals sector is presenting an equally compelling narrative, particularly when examining the recent price action in copper.
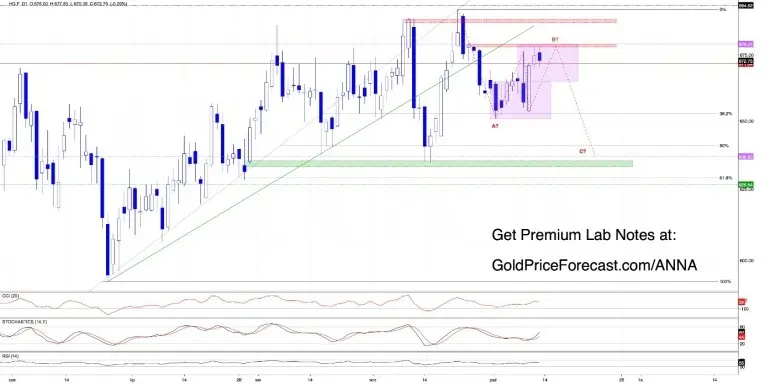
Copper bulls entered the week with a straightforward and well-defined objective. After confirming a breakout above a purple consolidation zone stretching from 650.90 to 664.60, the minimum upside projection—calculated directly from the vertical height of that technical formation—pointed cleanly toward the 679 price area.
While that represented a perfectly reasonable technical target, market strategists had already highlighted a major catch. That projected target sits directly in the path of a bearish price gap located at 678.05 to 679, left behind during the September 25 trading sessions. Closing that specific gap was viewed as an essential prerequisite for removing an immediate source of overhead resistance and paving the way toward subsequent obstacles. Market watchers noted that the behavioral interaction between buyers and sellers around these precise zones would dictate copper’s next major directional wave.
As it turns out, market participants did not have to wait long to see how that dynamic would play out.
The Bears Defend Their Territory
Following the latest technical updates, copper buyers attempted to extend their advance, pushing aggressively into the heart of the bearish gap.
The resulting battle at the resistance barrier saw sellers successfully defend their ground. Interestingly, Tuesday’s Asian trading session opened higher, carving out a fresh bullish gap that provided buyers with an extra layer of intraday support. Yet, even with that technical tailwind at their backs, the bulls could not muster the momentum required to pierce the overhead resistance ceiling.
Sellers once again refused to yield an inch. The failed breakout attempt was swiftly met with renewed selling pressure, leaving the broader bullish continuation scenario unfulfilled. When a market repeatedly batters itself against a fixed resistance area without making meaningful headway, experienced traders know to look closer at the underlying price structure, as subtle shifts beneath the surface often foreshadow larger movements.
Could the Recent Rally Have Been Wave B?
A closer inspection of the potential wave structures visible on the daily charts reveals the formation of a possible bearish A-B-C zigzag pattern.

Under this Elliott Wave interpretation, the recent upward price advance may not have been the start of a new bull run, but rather a corrective wave B within a larger downward sequence. If this specific hypothesis proves correct, the market could still find itself facing wave C—a potentially substantial and sharp decline.
Assuming that wave A and wave C share roughly equal length parameters, the resulting downside projection points directly toward the 637 area. While that represents a meaningful move worth monitoring, market professionals stress that this remains a developing theoretical scenario rather than a confirmed market reversal. The wave interpretation simply provides a roadmap of possibilities to watch, rather than a guarantee of where prices are headed.
What Would Invalidate the Bearish Scenario?
For those tracking the industrial metal, the critical upside threshold remains fixed at 679.
A confirmed daily close above the 679 mark, accompanied by the complete closure of the aforementioned bearish gap, would entirely invalidate the proposed bearish development and force analysts to quickly reassess the technical landscape. Until that occurs, however, the current chart configuration leaves plenty of room for renewed downside pressure.
Other market signals could eventually add weight to a larger decline, such as the formation of a bearish double top pattern or a consolidation phase that eventually breaks down below its lower support boundary. At present, neither of those confirming signals has materialized. Consequently, the 670-679 price corridor commands intense focus from traders, as market participants wait to see whether buyers are gathering strength for another assault or if sellers are quietly establishing control over the broader trend.
The overarching takeaway for industrial metals is clear: copper’s latest failure to overcome resistance has opened the door to a credible bearish alternative. However, treating that A-B-C pattern as a done deal requires waiting for concrete price confirmation. For the time being, the action centered around the 670-679 range will dictate the next chapter for the market.
Across the broader metals complex, divergent trends continue to unfold. Gold is maintaining its defense of a recent bullish breakout, silver is steadily approaching a crucial test of its underlying support levels, and both platinum and palladium are continuing to absorb heavy selling pressure.
Ultimately, a failed technical follow-through in the dollar and a stubborn resistance wall in copper provide plenty of analytical material, but neither development tells the complete story just yet. For the currency market, the daily close will clarify the status of the dollar’s breakout, while copper’s behavior around the 670-679 band will determine whether the bulls have another push left or if the bearish correction scenario takes hold.
In volatile trading environments, forcing a directional bias before the market commits is rarely a winning strategy. Letting the key technical levels guide the analysis and waiting for undeniable confirmation remains the most prudent path forward.