




When financial markets finally reach a technical target that traders and analysts have been monitoring for days, the immediate reaction often dictates the next major directional phase. Sometimes, the achievement of a projected level triggers an immediate and sharp decline, while in other instances, it sets the stage for a dramatic market reversal. However, professional market observers know that the most crucial development rarely happens the moment a target is hit; instead, it is revealed by how the asset behaves at the subsequent closing price, where broader institutional positioning and longer-term sentiment collide.
This week’s Friday trading session offers two fascinating and distinct examples of this market dynamic across the commodities complex. In the precious metals sector, gold has pushed through a previously discussed downside objective near the 4080 level and aggressively challenged the psychological 4000 barrier, leaving behind multiple technical scars, including two prominent bullish gaps that are now facing severe tests. Meanwhile, in the industrial metals space, copper has successfully reached its projected C equals A objective near the 637 mark, staging an impressive and powerful rebound that has nevertheless run straight into a formidable overhead resistance zone.
Both markets now find themselves asking the same overarching question: has the recent corrective move fully exhausted itself, or is this merely the preliminary stage of a much larger, more systemic development? To answer this, market participants must examine the underlying technical evidence, evaluate the integrity of key support and resistance boundaries, and wait for the confirmation that only higher timeframe closing prices can provide.
Gold (GC.F): From 4080 to the Battle for 4000
The latest U.S. trading session successfully completed the downside objective near the 4080 level that had been outlined in previous lab notes. As selling pressure intensified, market participants also tested the upper boundary of a red falling wedge pattern situated around 4050, which neatly coincided with a broader support area previously identified between the 4036 and 4060 range.
As Friday’s session got underway, the market opened lower, leaving behind a fresh bearish gap spanning the 4040 to 4060 region. Aggressive selling soon drove prices down to an intraday low of 4001.10, representing a profoundly serious test of the psychological 4000 barrier. This crucial psychological milestone also converges closely with an important rising weekly support line, making it a focal point for both bulls and bears.

One technical detail makes this particular setup exceptionally compelling: the newly formed bearish gap almost entirely overlaps with an older bullish gap that was established on July 30 between 4036 and 4060. Consequently, the very zone that previously acted as a reliable support area is now transforming into a stubborn overhead obstacle for any attempted recovery. During Friday’s session, prices managed an intraday high of 4047.57, which pushed into the newly formed bearish gap but failed to reach its upper boundary.
Market technicians are now closely monitoring specific closing parameters to determine the next directional bias. A daily close beneath the 4036 mark would confirm the complete closure of the July bullish gap, effectively erasing that historical support footprint. Conversely, a daily close above 4060 would be required to confirm the closure of the newly formed bearish gap, signaling a potential shift in short-term momentum. At present, neither outcome has been definitively established.
The broader, higher-timeframe question facing the gold market is even more significant. Gold has been trading comfortably beneath a weekly bullish gap spanning the 4098 to 4135 region. However, standard technical methodology dictates that only a weekly close below 4098 can confirm the complete closure of this higher-level gap. While technical indicators such as the Relative Strength Index and Stochastic oscillators look notably weak on the weekly chart, the convergence of the 4000 psychological level with historical support could still provoke a powerful counter-reaction from buyers. Ultimately, the immediate bearish objectives have been successfully reached, and the defense of the 4000 level alongside the ongoing gap-closing tests will dictate the next chapter for the precious metal.
Copper (HG.F): The ABC Projection Is Hit and the Market Weighs Its Next Move
Copper has provided one of the week’s clearest demonstrations of a fundamental trading principle: reaching a projected price level marks the beginning of a fresh analytical decision, not the termination of technical evaluation.
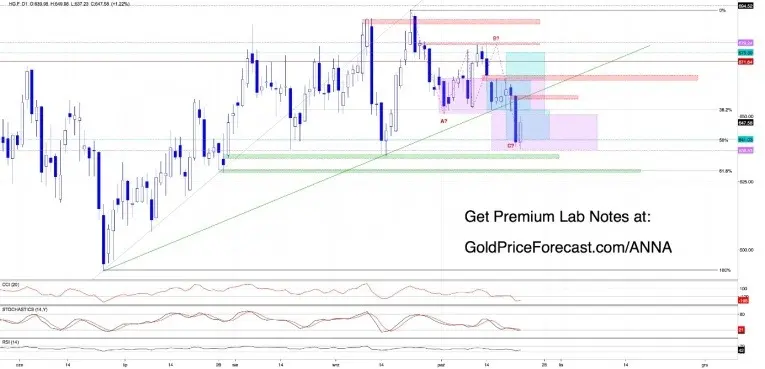
Following a notable decline earlier in the week that brought prices down to test the 50% Fibonacci retracement level around 641.03, Friday’s session saw the market print a low at 637.23. This move came within a fraction of a point of the previously projected C equals A objective near the 637 mark, which had been highlighted in earlier premium lab notes. Prompted by this technical milestone, market buyers stepped in and staged a sharp, aggressive rebound that carried prices upward toward a high of 647.58.

Despite the impressive recovery, copper quickly ran into a brick wall of selling pressure. Friday’s intraday high reached 649.98, stopping a mere two ticks below the crucial 650 threshold. This level represents a critical technical confluence area, situated near the lower boundary of a weekly rising wedge pattern as well as the broken support of a previous short-term consolidation phase.
This price action sets up two distinct and competing technical interpretations for market participants to weigh over the weekend. If bullish traders can successfully reclaim the 650 level and subsequently push past the broken daily rising trendline situated near 656, the recent C equals A objective could ultimately mark the definitive end of the correction that followed the larger advance which began back in June. However, if these overhead barriers successfully reject the ongoing rebound and Friday’s price action confirms a weekly wedge breakdown, the recent ABC decline may instead be reinterpreted as merely the first leg of a much larger and more prolonged corrective phase.
Should the bearish scenario unfold, the next logical combination of downside support is located in the 625 to 629 price range. Crucially, the 629 level represents the measured projection of the early-October orange consolidation phase. Furthermore, it converges neatly with the 61.8% weekly Fibonacci retracement level near 629.35, thereby reinforcing the overall structural importance of this specific support zone. As is often the case with complex technical structures, a confirmed weekly close is required to validate the wedge break, meaning neither interpretation can be treated as absolute certainty until the final bell sounds.
Friday’s Decision Map Across Key Commodities
As market participants prepare for the weekend interval, several distinct structural levels across the commodities complex require close observation. For gold, traders will continue to monitor the critical 4000 threshold alongside the overlapping gap zone spanning 4036 to 4060. A daily close beneath 4036 will serve to confirm the closure of the July bullish gap, while a weekly close below 4098 would officially confirm the closure of the larger weekly bullish gap. For the immediate-term bias to improve, bullish traders must successfully reclaim the 4060 level.
In the industrial metals sector, copper has successfully accomplished its C equals A objective near the 637 mark, but the onus remains on buyers to reclaim the 650 level and push beyond the broken rising trendline near 656. If a weekly wedge breakdown is officially confirmed, market attention will quickly pivot toward the lower support zone between 625 and 629, where the downside projection of the October consolidation intersects directly with weekly Fibonacci support levels.

Beyond gold and copper, several other major commodity markets are approaching pivotal technical junctures as the weekly session draws to a close. The U.S. dollar recently attempted a recovery, briefly reclaiming two separate bearish gaps and the lower boundary of its former consolidation range, though it ultimately lacked the sustained momentum required to maintain those gains. Silver has continued to edge closer to its previously identified downside objective at 5340, while a freshly formed bearish gap complicates any near-term efforts by the market to regain lost support levels. Platinum is currently testing territory near its July low, prompting serious questions among analysts regarding whether buyers possess the conviction needed to defend a potential double-bottom formation. Meanwhile, palladium has successfully reached another established downside projection and is actively testing a particularly significant weekly channel boundary.
Ultimately, periods of intense technical convergence tend to test the discipline of market participants. After a week defined by precise target fulfillment, there is a natural temptation to assume that every subsequent move will follow a predictable linear path. However, experienced traders understand that disciplined market analysis requires patience, objective observation of closing prices, and a willingness to step aside when market structures remain unresolved. The market has successfully delivered on several key projections, but the final closes of the week will provide the definitive verdict on which technical structures ultimately survive.