



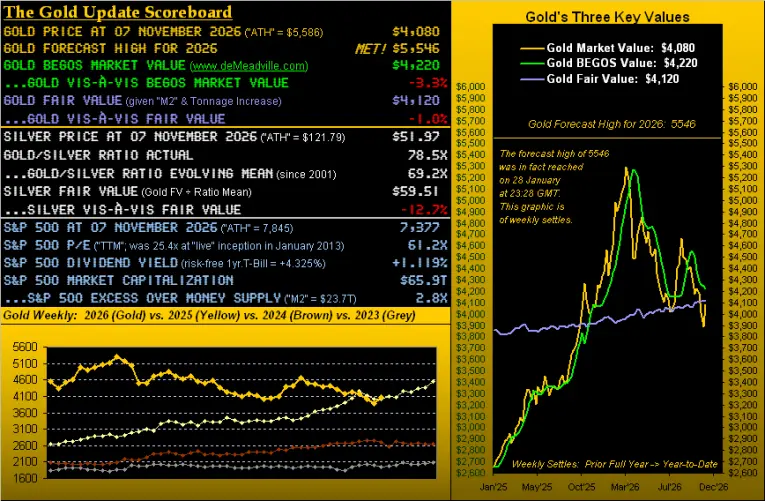
Last week’s market activity proved to be far more than just "busy," unfolding as a genuinely frenetic period driven by high-stakes U.S. election results, critical employment data, and a wave of corporate earnings. While precious metals experienced a powerful upward surge, the broader equities market faced a steep correction. Gold climbed impressively from its intra-week lows to highs, registering a robust 6.9% gain, whereas the S&P 500 stumbled significantly, sliding 4.7% from its high-water mark to its lows.
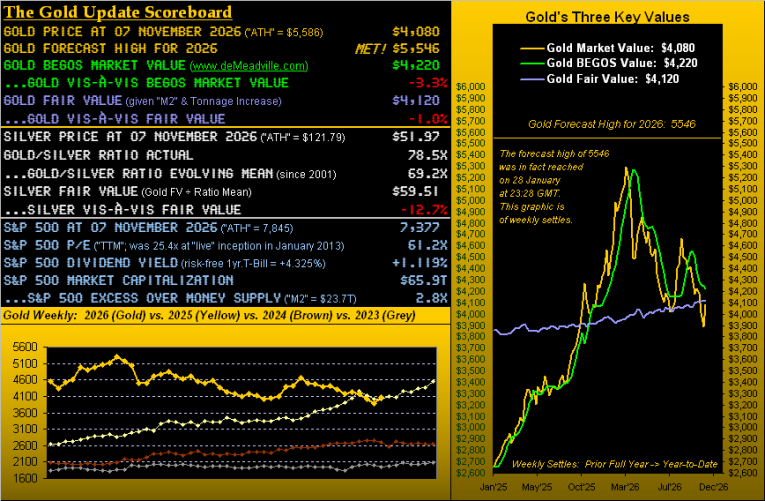
This divergent performance offered a striking contrast between an undervalued gold market and an overextended equities index. When the dust settled on the week’s trading, gold booked a net gain of 5.0%, marking its fourth-best weekly performance out of the 44 full trading weeks recorded year-to-date. Conversely, the S&P 500 suffered a 2.7% net loss, its worst weekly showing so far in 2026 and its deepest weekly drawdown since the period ending April 4, 2025. This sharp downturn prompted widespread panic across financial media outlets, with reports declaring that investors had virtually nowhere to hide and were rushing for the exits en masse.
However, veterans of market history point out that a modest 4.7% intra-week pullback in the S&P 500 hardly qualifies as a true exodus. Market observers with long memories recall far more turbulent financial panics, including the market shocks of 1987, the Asian financial contagion in 1997, the Russian debt crisis in 1998, the dot-com bubble burst in 2000, the global financial crisis in 2008, and the pandemic-driven disruptions of 2020. Analysts continue to monitor systemic risks, particularly the stark divergence reflected in the "S&P 500 Excess Over Money Supply" metric, which sits at an elevated multiple of 2.8x, underscoring lingering concerns over asset valuations relative to broader liquidity.

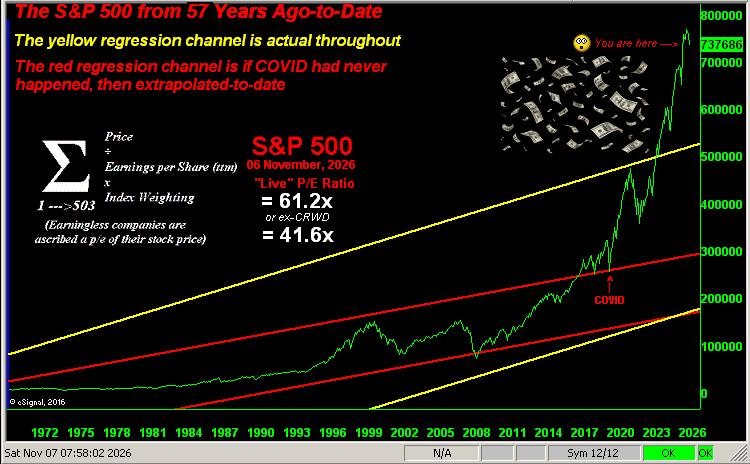
A long-term examination of the S&P 500 from 1970 to the present illustrates the massive expansion of equity values. When evaluated on a logarithmic chart, the index’s internal regression line places long-term baseline values significantly lower—roughly 34% below current trading levels near 7,377. This valuation gap persists even as trillions of dollars injected during the pandemic era remain embedded within the broader financial system, having permanently expanded corporate market capitalizations.
The current outlook for equities presents a classic mixed bag of positive and negative factors. On the bright side, the outcome of the U.S. midterm elections points toward a familiar political dynamic: legislative gridlock. Historically, a divided government—where a legislative branch eager to pass new laws is counterbalanced by an executive veto—often benefits both the broader economy and the stock market by moderating sweeping policy shifts. On the downside, the S&P 500 continues to grapple with a stratospherically high price-to-earnings ratio. Even excluding extraordinary outliers, the index’s P/E ratio stands at an elevated multiple, nearly triple the traditional 11x to 15x range historically deemed acceptable for a sustainable bull market under classical portfolio theory.
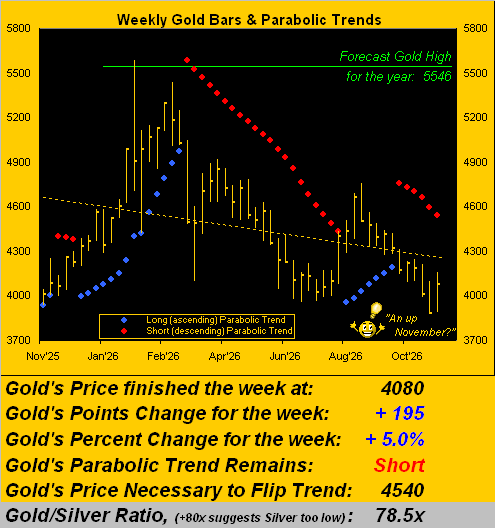
Moving past the equities market, attention turns directly to precious metals. Reviewing weekly trading bars from the past year, gold recently printed its sixth consecutive red dot on its parabolic short-term trend indicator. More importantly, however, gold’s strong recovery week—settling at 4,080—substantially narrowed the technical gap required to flip the trend back to a bullish long status. Given gold’s current average weekly trading range alongside favorable historical November seasonality, market technicians note that the trend could potentially shift to long before the end of the month. Historically, three out of the last four Novembers have yielded positive returns for the yellow metal, supporting the notion that gold and silver remain notably inexpensive relative to broader macroeconomic conditions.
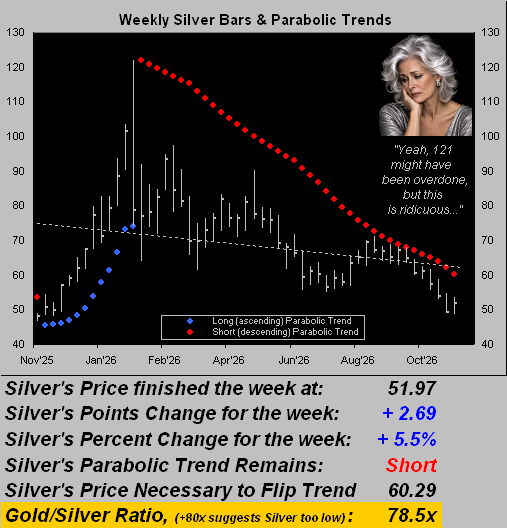
Sister silver tells a similarly compelling story, though its short-term trend has endured a formidable 40-week duration under a red-dotted parabolic short framework. With gold holding at 4,080, if silver were priced closer to the gold-silver ratio’s evolving historical mean of 69.2x rather than its current elevated level of 78.5x, it would trade roughly 12% higher. Current fair value metrics for silver place the target near 59.51, offering considerable upside potential should momentum shift.
Cousin copper has also experienced downward pressure, declining 9.6% from its all-time high set in late September. While this industrial metal correction has exerted some negative influence on silver, silver’s steeper 23.7% pullback over the same timeframe appears disproportionate compared to gold’s more modest 7.6% dip, leaving analysts particularly bullish on silver’s value proposition at these depressed levels.
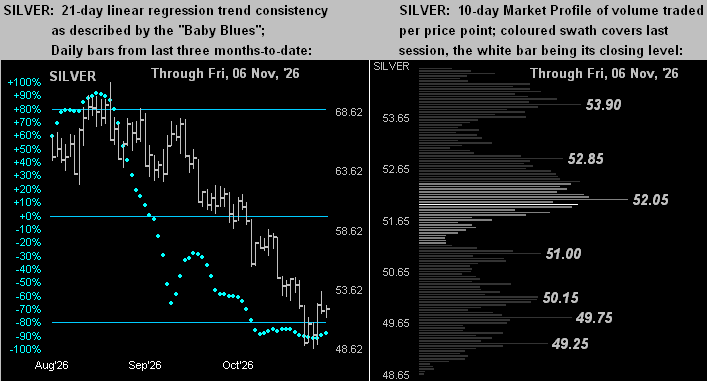
An examination of daily regression trend consistency for silver reveals that the indicator’s consistency dots are just beginning to curl upward. A confirmed close above key resistance levels would signal the potential for higher prices, despite an overhead array of structural price blockages. Meanwhile, silver’s market profile reveals that its recent 5.5% weekly gain has lifted it well above its previous lows, positioning it just beneath the dominant volume resistance level of the past fortnight.
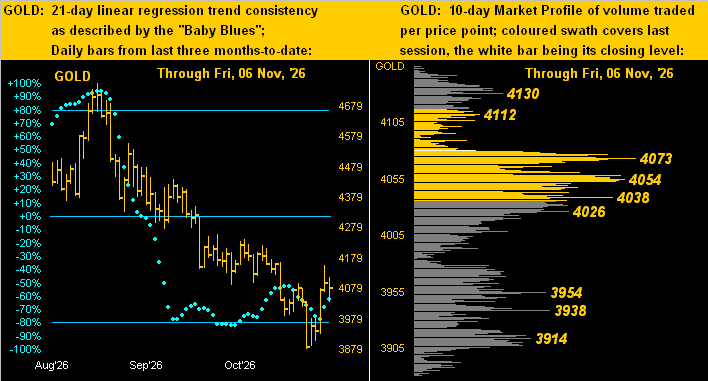
Gold’s technical charts show a comparable setup, with short-term regression consistency indicators rebounding from oversold territory. On the market profile front, gold has successfully climbed above newly established volume-dominant support levels, raising hopes that the crucial psychological floor near the 4,000 threshold has successfully held, despite the ongoing constraints of the weekly parabolic short trend.
On the macroeconomic front, the political landscape is shifting as opposition forces prepare to take control of Congress in early January, though without achieving a veto-proof majority. The electoral rebuke of the current administration reflected widespread public frustrations surrounding conflicts, inflation, and intense political polarization amplified by social media. Nevertheless, responsibility for stewardship of the broader economy rests with the sitting administration.
Despite persistent inflation—with annual figures running at an average of 4.3%, double the Federal Open Market Committee’s 2.0% target—the underlying economy continues to demonstrate resilience. This strength is vividly illustrated during the ongoing third-quarter corporate earnings season. With the reporting period nearing its conclusion, an overwhelming 79% of reporting S&P 500 constituents have beaten earnings expectations compared to the same period a year ago. Excluding the post-pandemic economic rebound, this earnings season is on track to deliver the strongest performance since the third quarter of 2018.
Furthermore, the Federal Open Market Committee’s recent policy statement noted that economic activity is expanding at a strong pace, even as inflation remains somewhat elevated. Economic data released over the past week underscored this resilience, with the bulk of tracked metrics—including October nonfarm payrolls, hourly earnings, September factory orders, and third-quarter productivity—beating consensus forecasts and prior revisions. This robust economic backdrop continues to fuel market speculation regarding the Federal Reserve’s next policy moves at its upcoming December meeting.
Looking ahead, the macroeconomic calendar features crucial updates on October inflation through both the Consumer Price Index and the leading Producer Price Index. Consensus estimates suggest that both retail and wholesale inflation measures may show further cooling. Market participants in the precious metals space will be closely watching to see how these inflation figures impact monetary policy expectations and whether gold and silver can maintain their upward momentum against shifting economic currents.