



Yesterday’s market breakouts carried an undeniable sense of promise, sparking optimism among traders looking for fresh momentum across major asset classes. However, the subsequent price action has swiftly introduced a wave of uncertainty, prompting financial analysts and market participants to question the durability of these recent moves. Rather than cementing a decisive shift in trend, the latest sessions are raising a series of uncomfortable questions about whether these bullish attempts represent genuine directional shifts or merely fleeting head fakes in an ongoing consolidation phase.
The focal point of this reassessment centers on two critical assets: the U.S. dollar and industrial bellwether copper. In the foreign exchange market, the greenback has slipped back below its recently breached consolidation boundary, struggling to maintain its footing after an initial surge. Meanwhile, industrial metal buyers have once again collided with a formidable wall of resistance, failing to crack a crucial overhead barrier. In the case of copper, this inability to advance has brought a potentially bearish A-B-C correction scenario sharply into focus.
Are these developments simply temporary setbacks within a broader trend, or do they signal a more significant shift in market dynamics? The answer increasingly appears to depend on a handful of pivotal technical levels that are currently being tested in real-time. A closer examination of the charts reveals a delicate balance of power between bulls and bears as both assets navigate treacherous technical territory.
U.S. Dollar (DX.F) – A Breakout That Didn’t Get Very Far
When analyzing both the daily and weekly charts for the U.S. dollar, an objective observer might be tempted to conclude that the bullish camp successfully achieved its primary objective. The evidence supporting this view initially appeared quite compelling. Monday’s trading session delivered a fairly impressive white candlestick, accompanied by a definitive daily close above the upper boundary of the orange consolidation range, which spans between 101.67 and 102.27.
To many market participants, this development looked like a textbook technical breakout—a clear signal that the dollar was ready to break out of its recent range and embark on a more sustained upward trajectory. From a purely structural standpoint, it was a positive technical development that checked several boxes for trend-following investors.
So why did the rally grind to an abrupt halt, and why wasn’t the momentum sustained into the following sessions?
The answer lies just overhead, where a dense concentration of technical resistance proved to be an insurmountable obstacle for the eager buyers. Specifically, the key resistance zone sitting between 102.36 and 102.49 acted as a formidable barrier. The strength of this area is hardly surprising when examining the broader technical landscape. This specific price cluster brings together the green rising resistance line clearly visible on the weekly chart, alongside a significant 127.2% Fibonacci extension level. When factoring in the lingering negative divergences apparent on several momentum indicators, the bearish camp was armed with a remarkably solid technical argument for pushing back against the advance.
And push back they did. Tuesday’s Asian trading session opened with a notable bearish gap, establishing a range between 102.33 and 102.37. Sellers quickly seized upon this opportunity to assert dominance, aggressively pressing their advantage and driving the dollar back below the previously breached upper boundary of its consolidation range. Suddenly, the triumphant breakout from just 24 hours prior began to look considerably less convincing, leaving bulls scrambling to defend their newly won territory.

What Happens If the Bears Hold Their Ground?
As market participants parse the implications of this failed follow-through, the daily close has emerged as a critical moment for determining the near-term direction of the currency.
Should the dollar finish the session below the crucial 102.27 threshold, it would serve formal confirmation of the breakout’s invalidation. Such an outcome would effectively erase Monday’s gains in the eyes of technical traders, substantially increasing the probability of further downward pressure. If sellers manage to press their advantage, the first notable downside support area combines the lower boundary of the consolidation pattern at 101.67 with the bullish gap formed on October 7, which ranges from 101.60 to 101.70.
However, the broader structural outlook for the currency continues to hinge upon another, more deeply established support zone. As analysts have repeatedly emphasized, the significant swing highs recorded in June and July—situated between 101.49 and 101.57—remain the ultimate bedrock shaping the broader market outlook. That fundamental technical reality has not changed, regardless of the short-term noise surrounding the failed breakout.
Conversely, for the bullish camp to regain absolute control of the narrative, simple intraday recoveries will not suffice. Buyers would need to demonstrate sustained commitment by first closing the bearish gap established between 102.33 and 102.37. More importantly, however, they would need to secure a decisive daily close above the stubborn resistance zone at 102.36-102.49. Until that high-water mark is decisively cleared, yesterday’s breakout remains highly vulnerable to further erosion. Ultimately, the bulls won the initial battle, but they have failed to secure the territory, leaving the market at a tense crossroads where the daily close will dictate whether the move was a genuine advance or another false dawn.
Copper (HG.F) – The Bulls Hit a Wall and a Potential A-B-C Correction Takes Shape
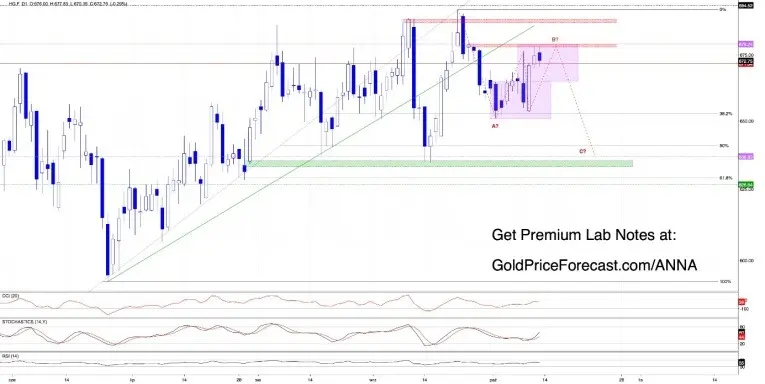
While the currency markets grapple with fading momentum, the industrial metals sector—specifically copper—presents an even more intriguing technical setup. Copper bulls entered the latest sessions with a straightforward and well-defined objective. Following the confirmation of a breakout above the purple consolidation formation spanning 650.90 to 664.60, the minimum upside projection derived from the height of that technical structure pointed directly toward the 679 area.
While this was a completely rational and textbook technical target, it came with a notable caveat that analysts had previously flagged. That projected target happened to coincide directly with a bearish price gap left open between 678.05 and 679 on September 25. Closing that specific gap was recognized as a necessary step to clear out overhead resistance and open the path toward further gains, turning the behavior of buyers and sellers around this critical zone into a masterclass in market dynamics.
Following these initial assessments, copper buyers did attempt to press their advantage, extending their advance to challenge the aforementioned bearish gap. The response from the seller side was immediate and decisive. Sellers successfully defended their territory, rebuffing the advance and setting the stage for a compelling subsequent session. During Asian trading hours, the market opened higher, creating a fresh bullish gap that theoretically provided buyers with an additional cushion of support.
Yet, even with this tactical advantage, the buying pressure proved insufficient to pierce the overhead resistance ceiling. Sellers once again refused to yield, and the subsequent lack of follow-through triggered a wave of renewed selling pressure that left the broader bullish continuation scenario unfulfilled. When a market repeatedly bangs its head against the exact same resistance level without making structural progress, experienced analysts know to look beneath the surface for signs of a more significant trend shift.

Could the Recent Rally Have Been Wave B?
A deeper examination of the developing wave structure on the daily chart reveals a compelling possibility: the formation of a potential bearish A-B-C zigzag pattern. Under this particular Elliott Wave interpretation, the recent upward push may not have been the start of a new impulsive bull run at all. Instead, it may have simply represented wave B within a larger, ongoing corrective formation.
If this hypothesis ultimately proves to be correct, the market could still find itself facing wave C—a potentially substantial downward leg that could exert renewed selling pressure across the industrial metal. By measuring the potential length under the assumption that wave A and wave C share equal proportions, the resulting downside projection points uncomfortably toward the 637 area.
It is worth noting that this interpretation remains a developing scenario rather than a confirmed reversal. The wave structure offers a plausible roadmap that deserves close monitoring, but it does not mean the market has definitively committed to that bearish path.
The definitive line in the sand for invalidating this downside scenario remains anchored at the 679 level. A convincing daily close above 679, accompanied by the complete closure of the September bearish gap, would dismantle the proposed A-B-C development and force a rapid reassessment of the technical landscape. Until that threshold is decisively broken, the prevailing technical environment leaves ample room for renewed downside pressure to materialize.
Whether this pressure eventually takes the form of a classic double top formation or develops through a messy consolidation followed by a breakdown of range support remains to be seen. For now, the 670-679 corridor commands the undivided attention of market participants, as the impending price reactions within this zone will likely dictate whether industrial metal buyers can muster another offensive or if sellers are successfully steering the market toward a deeper correction.
As these dynamics play out, the broader commodities and precious metals complex continues to reflect a mosaic of contrasting fortunes. Gold continues to put up a resilient defense of its recent bullish breakout, while silver inches closer to a significant test of its underlying support levels. Meanwhile, platinum and palladium are encountering renewed bouts of selling pressure, underscoring the selective nature of current market trends.
Ultimately, the failure of the U.S. dollar to follow through on its breakout and copper’s ongoing struggle against heavy resistance serve as potent reminders of the market’s complexity. Neither development provides a definitive roadmap for the weeks ahead on its own, but both offer vital clues. For the currency markets, the daily close will clarify the true state of the dollar’s breakout. For industrial metals, the ongoing battle around the 670-679 zone will reveal whether the bulls have any fight left or if the bearish alternative is gaining structural credibility. In an environment defined by hesitation, the wisest approach remains grounded in discipline: let the technical levels guide the analysis, and let definitive confirmation guide the final conclusions.