




It was certainly not the Friday that precious metals bulls had envisioned. As the trading week draws to a close, a wave of persistent selling has driven gold below the significant 4,000 threshold, while silver has cleanly broken through the 5,000 mark. Following several consecutive sessions of downward momentum, both primary precious metals are now testing major technical boundaries that could dictate market trajectories for the weeks ahead.
What makes this end-of-week session particularly noteworthy is that these moves represent far more than the temporary giving way of standard psychological price levels. Gold is currently confronting a rising support line that has closely accompanied its long-term upward trajectory for years. Silver, on the other hand, has pushed decisively through another critical technical barrier that market observers had been closely monitoring throughout its recent multi-day decline.
All of this downward pressure is converging just hours before the weekly candles are finalized, creating an unusually high-stakes environment for traders and investors alike. Market participants are now left to ponder whether buyers will finally step in to defend these crucial technical zones, or if sellers are successfully positioning themselves to enter November with a significantly strengthened technical advantage. The resolutions to these questions will likely offer far greater insight into the health of the precious metals sector than any single day of price fluctuations alone.
Gold (GC.F) – The Bears Reach a Long-Term Battleground
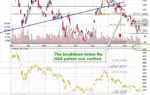
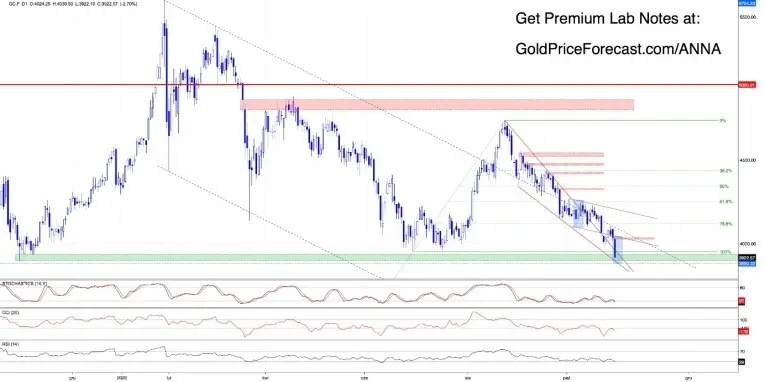
Gold bears have shown little intention of slowing their momentum as the trading week wraps up. Thursday’s decisive close below a prominent black declining channel handed sellers yet another technical advantage, and Friday’s bearish opening gap, registering between 4,024 and 4,031, provided the ideal launching pad for the next wave of selling pressure.
The consequences were immediate and severe. Gold plunged cleanly beneath the 4,000 level, pushed straight through the previous low established in June at 3,955, and continued its descent toward a much more consequential support area. Yet, this sharp decline has brought the market to a fascinating technical crossroads.
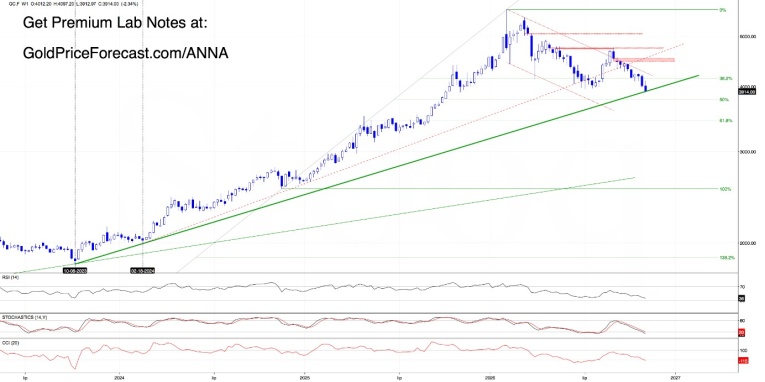
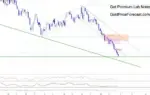
Today’s downward movement has not only fulfilled the projected downside target calculated from the height of the black declining channel, but it has also delivered gold directly to the lower boundary of a red falling wedge. Simultaneously, it has tested the long-term green rising trendline clearly visible on the weekly chart. When factoring in the historical support zone established by the October-November 2025 lows near 3,890, the market is suddenly confronting a dense technical battlefield capable of influencing gold’s broader direction well beyond the current session.
This convergence makes Friday’s closing prices vital for determining the near-term trend. If sellers succeed in securing confirmed daily and weekly closes below this layered support combination, the next notable downside objective could emerge around the 3,761 to 3,785 range. That specific zone marks the convergence of the weekly 50% Fibonacci retracement, measured from the November 2024 to February 2026 advance, and the daily 127.2% Fibonacci extension—a prospect that presents a distinctly uncomfortable scenario for market bulls.
Conversely, a successful defense by buyers could alter the narrative. A close above the current support cluster would prevent immediate confirmation of the breakdown, granting bulls a window to stabilize the asset. However, market analysts emphasize that merely defending support is not equivalent to regaining market control. For a convincing and sustainable bullish recovery to take shape, gold would need to recapture the 4,000 handle, completely close the morning’s bearish gap between 4,024 and 4,031, and reclaim the lower boundary of the black declining channel. Until those milestones are achieved, any intraday or short-term rebound will remain highly vulnerable to renewed waves of selling pressure.
Silver (SI.F) – The Bears Finally Break the Floor
Silver entered the final trading day of the week on an equally weak footing, opening with another distinct bearish gap in the 5,188 to 5,238 range that immediately invited further selling. However, the underlying warning signs had been quietly accumulating across previous sessions.
As noted in recent market reviews, buyers had repeatedly demonstrated an inability to close the bearish gap left open on October 23 between 5,466 and 5,500. Furthermore, they failed to reclaim the broken upper boundary of a red technical triangle. Thursday’s slide to a fresh local low near 5,202 served as a clear indicator of persistent underlying weakness.
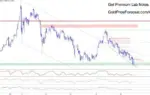
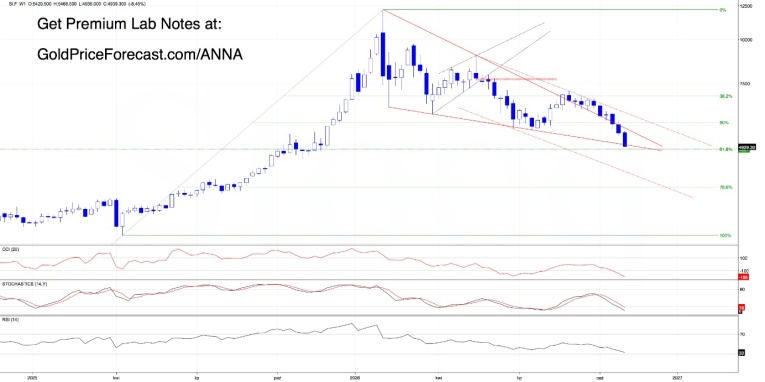
By Friday, the bears successfully breached the floor. Sellers drove prices straight through the psychological 5,000 barrier and past the lower boundary of the red triangle, touching a low of 4,931.30 and extending well beyond previously calculated downside targets.
The central question now facing the silver market is the potential extent of this ongoing correction. The initial significant support level rests near 4,870, where the weekly 61.8% Fibonacci retracement of the April 2025 to February 2026 upward leg comes into play. Should that threshold fail to halt the selling, analysts are eyeing the daily 150% Fibonacci extension situated near 4,837.05, followed closely by the 161.8% extension around 4690.41.
While this outlook poses a considerable challenge for silver bulls, an avenue for defense remains open. A decisive recovery pushing prices back above the 4,990 to 5,000 zone prior to the market close would effectively reclaim both the psychological barrier and the lower boundary of the red triangle, invalidating the immediate breakdown. Without such a late-session recovery, however, a confirmed daily and weekly breakdown will leave sellers firmly in control as the calendar turns toward November.
What About the Other Four Markets?
The dramatic volatility witnessed in gold and silver forms only a chapter of a broader movement across related asset classes this week. Platinum has successfully pressed through another previously identified downside objective, drawing a deeper combination of Fibonacci support levels into sharp focus. Palladium has similarly delivered on a prior bearish projection and is now actively testing a long-term support line—a technical development that could carry substantial weight if the weekly breakdown is ultimately confirmed. Meanwhile, copper’s attempted recovery has encountered significant obstacles as buyers struggle to invalidate an earlier weekly bearish signal.
In the broader macroeconomic currency space, the U.S. dollar is experiencing its own tactical battles. Following a series of repeated rejections at established resistance levels, dollar buyers are working urgently to prevent a further deterioration in the short-term technical outlook.
As traders navigate these complex conditions, attention turns toward synthesizing these cross-market signals with upcoming structural scenarios, mapping out critical support and resistance thresholds across all major commodities ahead of the opening bell on Monday.
Final Thought – The Weekend Changes the Perspective
There is a distinct value in stepping back from the live charts after a turbulent trading week. During the intense hours of the trading session, every sharp price swing and sudden breakdown can easily feel like the definitive event of the market cycle. Yet, when observers zoom out to view the broader multi-year context, a much more balanced picture frequently emerges.
A multi-year trendline, a foundational support zone that once catalyzed a major market rally, or a price level that suddenly finds itself at the center of a tug-of-war between institutional buyers and sellers—these are the historical locations where the next major chapters of a market’s story are written. With both gold and silver currently testing such critical technical territory, the precious metals space enters the weekend surrounded by vital questions that will demand close attention when trading resumes next week.