



Yesterday’s market breakouts carried an undeniable sense of promise, sparking optimism among traders looking for clear directional momentum across major asset classes. However, today’s emerging price action is rapidly replacing that optimism with a series of uncomfortable and pressing questions.
The financial landscape can shift remarkably fast, and the latest sessions have provided a stark reminder of that reality. The U.S. dollar has quickly slipped back below its recently broken consolidation boundary, surrendering the hard-fought gains it posted at the start of the week. Meanwhile, industrial metal buyers have once again collided with a formidable wall of resistance in the copper market, failing to break through a crucial threshold. In copper’s case, this recurring rejection has brought a potentially bearish A-B-C wave scenario squarely back into focus, forcing traders and analysts to re-evaluate their near-term outlooks.
Market participants are now left to ponder whether these sudden developments are merely temporary setbacks—routine tests of liquidity before a resumption of the broader trend—or if they signal something far more significant regarding macroeconomic sentiment. As is so often the case in technical analysis, the answers may ultimately depend on a handful of critical price levels that are currently being tested in real-time.
U.S. Dollar (DX.F): A Promising Breakout That Lost Momentum
Looking closely at both the daily and weekly charts of the U.S. dollar, an objective observer could easily argue that the bullish camp successfully achieved their immediate objective.
Almost, anyway.
Monday’s trading session delivered a fairly impressive white candle, characterized by strong buying pressure that drove the dollar to close decisively above the upper boundary of its orange consolidation range, situated between 101.67 and 102.27. From a purely technical standpoint, breaching this range represented a highly positive development, offering bulls a foothold to target higher valuations.
Yet, the natural question following such a move is simple: why did the rally fail to find continuation?
The answer lay directly overhead, waiting like an obstacle course for the advancing currency. A critical resistance zone residing between 102.36 and 102.49 proved to be an exceptionally difficult hurdle to clear, and for very sound technical reasons. This specific price area serves as a convergence point for multiple technical factors, notably bringing together the green rising resistance line clearly visible on the weekly chart and the 127.2% Fibonacci extension level. When traders add the persistent negative divergences visible on standard momentum indicators to this mix, it becomes evident that the market bears possessed a remarkably solid technical argument for launching a counter-offensive.
And push back they most certainly did.
The subsequent Asian trading session opened with a notable bearish gap spanning 102.33 to 102.37. Sellers quickly seized upon this opening weakness, stepping up their pressure and aggressively pushing the dollar back down below the previously broken upper boundary of its former consolidation range. Suddenly, the triumphant breakout celebrated just 24 hours prior no longer looks quite so convincing.

What Happens If the Bears Hold Their Ground?
As the current trading day unfolds, the daily close takes on an exceptionally high level of importance for market structure.
If the U.S. dollar manages to finish the session below the 102.27 threshold, it will officially confirm the invalidation of yesterday’s breakout. Such a confirmation would significantly increase the statistical probability of further downward revisions and renewed selling pressure.
In the event of a deeper correction, the first notable downside area combines the lower boundary of the broader consolidation zone at 101.67 with the bullish gap formed during early October, specifically between 101.60 and 101.70. However, analysts emphasize that the broader technical outlook continues to hinge on an even more fundamental line in the sand. As market watchers have repeatedly highlighted, the significant swing highs established in June and July—resting between 101.49 and 101.57—remain the absolute critical support area shaping the overarching macroeconomic perspective. That foundational assessment remains unchanged.
Conversely, what would it actually take to put the bullish camp firmly back in control of the narrative?
Buyers will need to demonstrate far more resilience than simply manufacturing another temporary intraday recovery. Successfully closing the current bearish gap at 102.33 to 102.37 would represent a constructive first step, but the far more substantial achievement required is a sustained daily close above the heavy resistance zone located at 102.36 to 102.49. Until buyers can achieve that definitive closure, yesterday’s breakout remains dangerously vulnerable to further erosion.
Bottom line: the bulls won yesterday’s initial battle, but they have thus far failed to secure and hold the territory. Today’s close will ultimately determine whether that breakout was a genuine advance or merely another failed attempt to pierce entrenched overhead resistance.
Copper (HG.F): Bulls Hit a Wall as A-B-C Correction Takes Shape
If the currency markets are showing signs of strain, the industrial metals sector presents an even more compelling technical narrative.
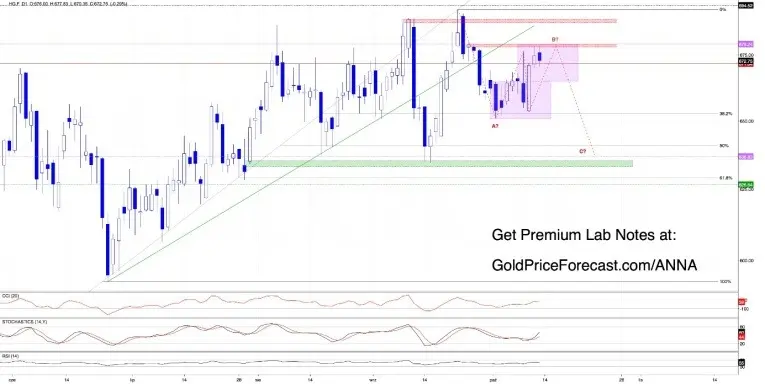
Copper bulls entered the recent sessions with a straightforward and well-defined objective. Following the market confirmation of a breakout above the purple consolidation formation spanning 650.90 to 664.60, the minimum upside projection calculated from the height of that pattern pointed directly toward the 679 area.
While that technical target was entirely reasonable within the context of the breakout, it came with a distinct caveat—one that was explicitly flagged in recent market notes. That projected target happened to sit directly adjacent to a significant bearish gap left open at 678.05 to 679 from late September. Filling that specific gap was recognized as a necessary prerequisite to remove a primary source of overhead supply and unlock the path toward subsequent obstacles. The real test was always going to be how market participants behaved as prices approached these tightly contested zones.
As it turned out, market observers did not have to wait long for a definitive answer. Following the publication of those initial warnings, copper buyers extended their advance and directly challenged the aforementioned bearish gap.

The resulting price action was telling. Sellers fiercely defended their territory, and subsequent trading sessions introduced further complications. Although a higher opening during Asian trading hours created a fresh bullish gap—providing buyers with a minor technical cushion—they still lacked the momentum required to punch through the overhead ceiling. Sellers repeatedly refused to yield, triggering a swift return of selling pressure that left the broader bullish continuation scenario unfulfilled. When an asset struggles time and again to conquer the exact same resistance region, astute analysts know to look closely beneath the surface for developing structural shifts.
Could the Recent Rally Represent Wave B?
When examining the potential wave structures visible on the daily charts, an alternative interpretation emerges, pointing toward a possible bearish A-B-C zigzag formation.
Under this analytical framework, the recent upward advance may not have been the start of a new bull run at all, but rather wave B of a larger, ongoing corrective pattern. Should this hypothesis prove accurate, the market could still be harboring wave C—a potentially substantial downward leg that has yet to fully materialize. Assuming that wave A and wave C ultimately share equal length, the resulting downside projection points uncomfortably toward the 637 area.
While this represents a meaningful potential shift in market direction, it is vital to maintain perspective. This remains a developing technical scenario rather than a confirmed market reversal. Wave interpretations provide valuable analytical possibilities worth monitoring closely, but they do not mean the broader market has definitively committed to that path.
Invalidating this emerging bearish setup requires a specific market response. The primary threshold to watch is the 679 level. A confirmed daily close above 679, accompanied by the complete closure of the nearby bearish gap, would effectively invalidate the proposed bearish development and force a complete reassessment of the technical landscape. Until such an event occurs, the prevailing technical structure leaves ample room for renewed downside pressure.
Questions naturally remain regarding what could ultimately serve as the catalyst for a broader decline. A classic bearish formation, such as a double top, could eventually materialize to offer additional confirmation. Alternatively, a newly developing consolidation followed by a breakdown below its lower boundary could spark the next major move. Neither of these confirmation signals has triggered just yet, which is precisely why the 670 to 679 price corridor commands such intense focus.
The immediate reactions around this pivotal zone will dictate whether buyers can muster the strength for another assault on resistance, or if sellers are quietly gathering enough momentum to transform a routine setback into a much larger market correction. For now, the 670–679 range stands as the frontline where the next chapter of this market cycle will likely be written.
Across the broader metals complex, similar tension is palpable. Gold continues to put up a resilient defense of its recent bullish breakout, while silver approaches a crucial test of its underlying support levels. Meanwhile, platinum and palladium are currently confronting renewed waves of selling pressure.
Ultimately, a technical warning should never be confused with a confirmed outcome. The dollar’s failure to follow through on its breakout and copper’s ongoing struggle against stubborn resistance are both developments that demand close attention, yet neither tells the entire story in isolation.
For the U.S. currency, the final daily close will help clarify whether yesterday’s breakout has truly broken down. For copper, the ongoing price action around the 670-679 zone will offer invaluable clues regarding whether the bullish camp has another push left in reserve, or if the alternative bearish scenario is rapidly gaining institutional credibility. In fast-moving markets, there is rarely any necessity to guess a direction before the price action forces the issue. Letting the key levels guide the analytical process—and allowing actual market confirmation to dictate the final conclusions—remains the most reliable path forward.