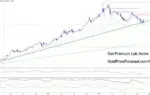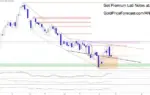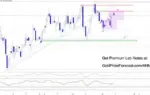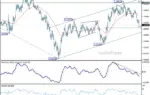





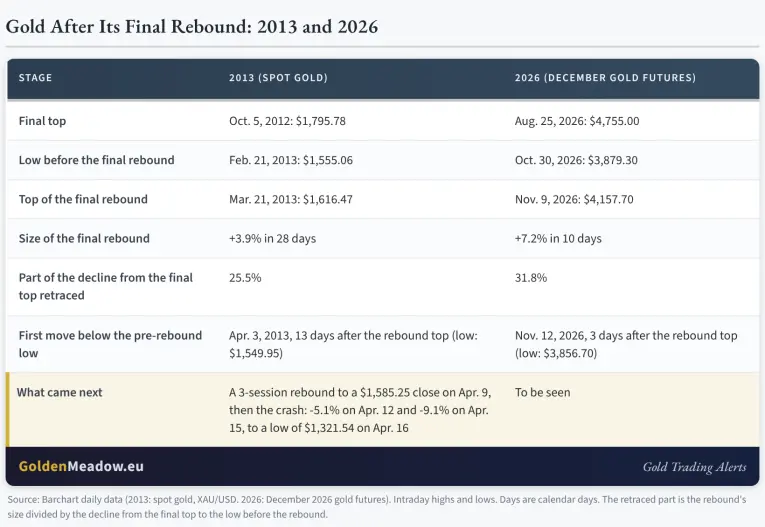
Gold prices are facing intense downward pressure, slipping to their lowest levels since late 2025 as a combination of surging Treasury yields and a resilient U.S. dollar overwhelms traditional safe-haven demand. December gold futures traded near $3,900 early in the session, following an overnight rebound up to $3,927.20. This comes on the heels of a brutal Thursday session that saw the precious metal plummet by $115.20 to settle at $3,885.30. During Thursday’s trading, gold hit an intraday low of $3,856.70, decisively breaching the previous low of $3,879.30 recorded on October 30.
This drop marks a new low for 2026 and brings prices down to levels not seen since early October 2025. More critically, technical analysts note that gold has broken below the key support level that initiated its most recent recovery wave.
Back on September 1, when bullion was trading near the $4,426 mark, market observers suggested that the coming months would likely mirror the volatile patterns witnessed in late 2012 and 2013 before any sustainable bull market could resume. Since that warning, gold has retreated by approximately 12 percent. Just days ago, following a temporary rebound peak of $4,157.70, analysts reiterated that the upward correction appeared to be the final relief rally, drawing direct parallels to the deceptive February and March rebounds of 2013 that immediately preceded a historic market crash in April of that year. Thursday’s decisive break below the October low has seemingly confirmed that structural shift.
The Breakdown That Preceded the 2013 Crash
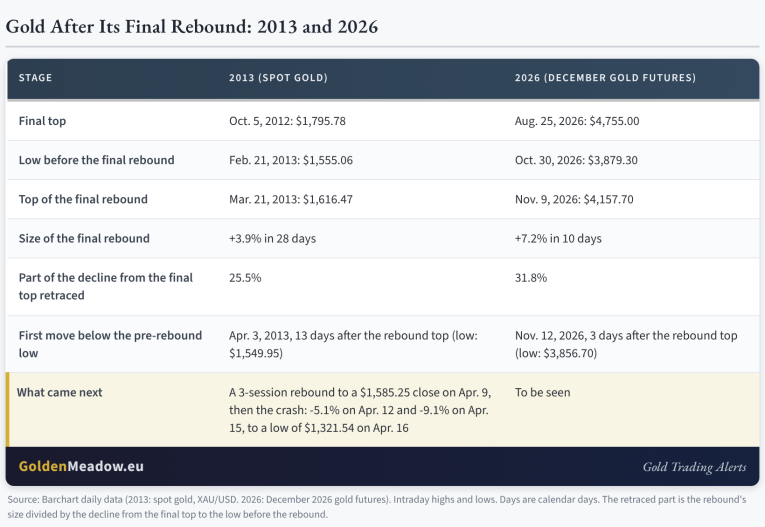
To understand the gravity of current market movements, financial historians often look back a little over a decade to the structural breakdown of 2013. During that cycle, gold experienced a final, temporary recovery that lifted prices from a February 21 low of $1,555.06 to $1,616.47 by March 21. That recovery proved to be a bull trap. On April 3, prices breached the prior February low, and by April 4, the metal registered a definitive close below that crucial threshold.
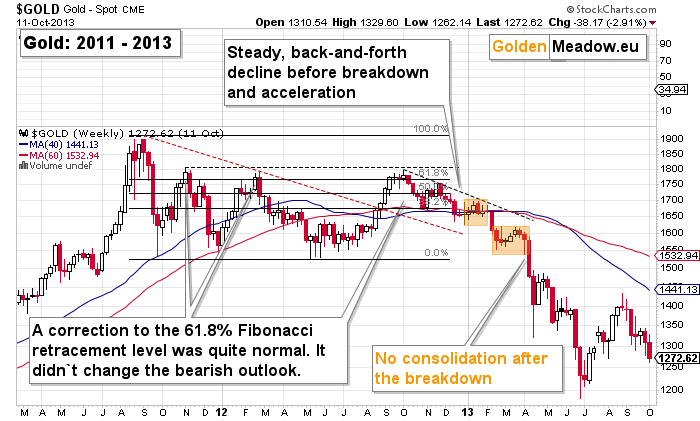
Following that initial breach, gold staged a brief, three-session counter-trend rebound, closing at $1,585.25 on April 9. However, the subsequent collapse was swift and severe. The primary crash kicked off just three sessions later, with gold tumbling 5.1 percent on April 12 and another 9.1 percent on April 15, ultimately bottoming out at $1,321.54 on April 16.
The 2026 Version Moves at an Accelerated Pace
While the underlying macroeconomic dynamics rhyme remarkably with 2013, the current version of the pattern is developing at a significantly faster pace. This year, the final relief rebound lifted gold from its October 30 low up to $4,157.70 on November 9. On Thursday, prices decisively slipped below that October low floor.
Whereas gold in 2013 required 13 trading days following the rebound’s peak to breach its pre-rebound low, this year’s market required a mere three days to accomplish the same downside break. Morning upswings and technical bounces are doing little to alter the broader bearish narrative. In 2013, the market also enjoyed a three-session recovery following the initial break before the major liquidation wave began. Today’s modest upward price action is viewed by market veterans as a mere verification of the breakdown into fresh 2026 lows, closely mirroring the historical precedent.
Even a slightly cooler Producer Price Index (PPI) report failed to spark a sustained rally. Government data showed that producer prices rose by 0.3 percent in October, falling slightly short of the 0.4 percent increase anticipated by economists polled by Dow Jones. Despite the softer inflation data, gold struggled to hold onto its overnight gains, underscoring the market’s current detachment from standard macroeconomic catalysts.
Rates and the U.S. Dollar Matter More Than War Headlines
The primary driver behind gold’s persistent weakness lies firmly in the cost of money, shifting bond yields, and currency valuations rather than geopolitical anxieties. Thursday’s sharp decline was directly correlated with shifting monetary policy expectations. Crude oil prices rallied, the benchmark 10-year Treasury yield surged by 12 basis points to hit 5.10 percent, and the U.S. Dollar Index (USD Index) futures closed at 103.094, marking its highest closing level of 2026.
Concurrently, fed funds futures at Thursday’s market close were pricing in more than one full interest rate hike for the upcoming December 8-9 Federal Open Market Committee meeting. Reinforcing this hawkish outlook, San Francisco Fed President Mary Daly publicly stated that her bias remains tilted toward the necessity of further monetary tightening.
An aggressive Federal Reserve tightening cycle is fundamentally bearish for non-yielding assets like gold. Higher bond yields increase the opportunity cost of holding precious metals, which generate no interest or dividends, while simultaneously providing robust support for the U.S. dollar.
Interestingly, escalating geopolitical tensions failed to provide any safe-haven bid for the metal. Reports emerged from Iran stating that four oil tankers had been struck by explosions in the strategic Strait of Hormuz, while political leaders publicly dismissed the prospect of reaching a diplomatic accord with Tehran. Despite these flashpoints, gold prices continued to slide. Events in the Middle East primarily influence gold through their impact on crude oil and energy markets, but at present, bullion is reacting far more strongly to interest rates and currency strength than to the threat of regional conflict. When a traditional safe-haven asset consistently fails to rally on major geopolitical stress, market analysts interpret it as a deeply bearish signal.
Where This Leaves the Precious Metals Market
By breaking decisively below its October low, gold has effectively terminated its final cyclical rebound. Given the striking structural similarities to the 2013 market collapse—where a brief counter-trend bounce was swiftly followed by a dramatic waterfall decline—analysts warn that gold’s path of least resistance points downward. The next major downside price target hovers around the $3,500 mark, aligning with extended macroeconomic forecasts. As the broader commodities complex adjusts to a higher-for-longer interest rate environment, traders continue to monitor currency strength, mining equities, and industrial bellwethers like copper for further warning signs regarding the health of broader financial markets.