




The major gold mining sector is wrapping up its third-quarter earnings season, delivering remarkably robust financial results despite navigating a technically volatile quarter for both bullion and gold equities. Driven by lower production and persistent general inflation, mining costs crept higher and compressed profit margins. Nevertheless, the industry’s leading operators still managed to secure their fourth-best quarter on record in earnings terms, falling just shy of the preceding quarter’s performance. These substantial profits have left gold-stock valuations hovering near historic lows, creating an intriguing setup for the broader precious metals market.
As the dominant benchmark for the sector, the VanEck Gold Miners ETF (GDX) continues to command an insurmountable lead since its inception in May 2006. With net assets standing at approximately $26.5 billion midweek, GDX dwarfs its next-largest competitor by nearly twelve times. The fund remains the undisputed trading vehicle of choice for the industry, heavily weighted toward the world’s largest gold mining operations.
Within the sector, producer tiers are typically defined by annual output in ounces of gold. Small juniors produce under 300,000 ounces, mid-tiers range from 300,000 to one million ounces, large majors yield over one million ounces, and super-majors exceed two million ounces. Translated into quarterly figures, the two largest categories alone account for a full 48% of the GDX weighting, anchoring the fund’s heavy exposure to major producers.
Component stocks within GDX performed admirably during the third quarter proper, driving the ETF up by 16.4% on the back of a modest 3.4% rally in physical gold. This amplified the metal’s gains by a factor of 4.9, significantly outpacing the typical historical leverage of two to three times normally exhibited by major miners. However, the path was far from consistent, featuring a blistering summer surge that ultimately rolled over into a sharp sell-off. Such pronounced volatility frequently spooks retail and institutional investors alike, contributing to the sector-wide apathy that continues to overshadow the space.
From mid-July to late August, GDX rocketed 49.2% higher, tracking a 17.4% surge in gold from major lows. This violent mean reversion was fueled by a technical breakout from a bullish chart pattern alongside increased buying of longer-term Treasury bonds. For roughly five weeks, gold equities soared alongside the underlying metal. However, this recovery was abruptly short-circuited by surging expectations for Federal Reserve interest rate hikes. This shift pulled forward and greatly exacerbated the traditional seasonal autumn pullback in gold. By late October, gold had corrected by 16.8%, while GDX absorbed a 27.0% loss, severely dampening investor sentiment and reigniting the prevailing bearish herd mentality.
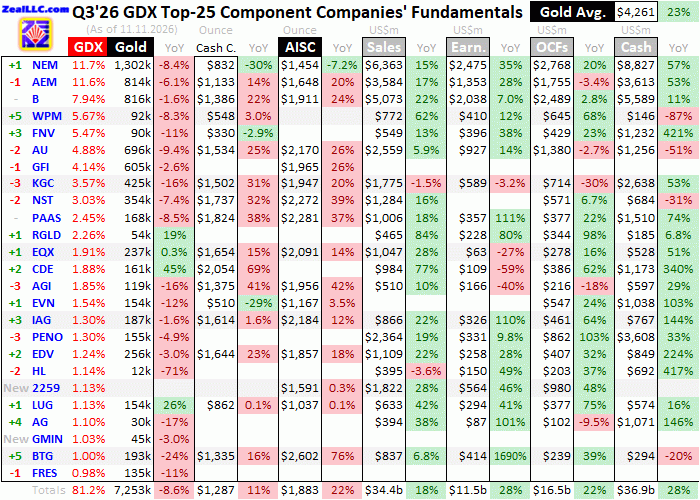
A detailed examination of operational and financial metrics from the top 25 component stocks in GDX—which represent super-majors, majors, and larger mid-tiers comprising 81.2% of the ETF’s total weighting—cuts
through the sentiment fog shrouding the industry. These top-tier miners have faced persistent hurdles regarding output. Due in part to shifting market capitalizations and index rebalancing, collective production for the GDX top 25 dropped by a notable 8.6% year-over-year in the third quarter down to 7.25 million ounces. This continues a multi-quarter trend of declining output among major producers, contrasting sharply with broader global supply trends reported by the World Gold Council, which indicate that global output growth is increasingly driven by smaller mid-tier and junior miners.

Mid-tier operators have historically demonstrated an ability to overcome depletion more effectively than their larger peers. Operating smaller stables of typically one to four mines, mid-tiers find that sizable expansions or new mine developments genuinely move the needle for production growth. Furthermore, despite the theoretical economies of scale enjoyed by massive super-majors, mid-tiers frequently maintain lower unit mining costs relative to their output, translating into enhanced profitability and stronger stock performance.
Unit gold-mining costs are generally inversely proportional to production levels because total operating costs are largely fixed during the pre-construction planning phases. Once a mine is operational, the plant’s nameplate capacity remains relatively constant quarter to quarter, requiring stable levels of infrastructure, equipment, and workforce. Consequently, the ore grades fed into processing plants become the primary variable driving gold production. Because mining plans naturally target richer ores first, grades eventually decline over time, leaving lower-quality material. While majors attempt to offset this through expensive corporate acquisitions, the sheer scale at which they operate has often proven difficult to sustain organically.
Classic cash costs, which account for all direct expenses required to extract an ounce of gold, serve as a survivability metric for major producers, illuminating the minimum gold prices necessary to keep operations running. During the third quarter, average cash costs for the GDX top 25 surged 11.1% year-over-year to $1,287 per ounce, representing the third-highest level on record. This figure was notably skewed by Coeur Mining, which reported an extreme cash cost metric of $2,054 per ounce due to unique non-cash purchase price allocation accounting following its acquisition of New Gold. Excluding this outlier, the average cash cost for the remaining top producers sat closer to $1,239 per ounce, remaining well below prevailing market prices for bullion.
All-in sustaining costs (AISCs), introduced by the World Gold Council to provide a comprehensive measure of ongoing operational expenses, present an even clearer picture of profitability. Collective AISCs among the GDX top 25 reached a record average of $1,883 per ounce in the third quarter, surging 22.0% year-over-year. Industry analysts point to two primary drivers behind this upward pressure: contractually bound royalty expenses and broader macroeconomic inflation.
Because royalty payments are typically calculated as a percentage of the prevailing gold price, the quarter’s high average gold price of $4,261 per ounce—up 23.2% year-over-year—automatically drove up royalty burdens for a significant portion of global mines. At the same time, general cost inflation, particularly regarding energy inputs like diesel fuel used to power heavy mining equipment, continued to plague operations. National retail diesel prices experienced substantial increases year-over-year, impacting remote mine sites globally and leading major operators like Agnico Eagle Mines and Kinross Gold to warn that full-year cost metrics would trend toward the upper end of their guidance ranges.
Despite these cost pressures, when examined as a ratio against prevailing gold prices, AISCs represented just 44.2% of the quarterly average gold price, marking the fifth-lowest relative level in historical data. Furthermore, subtracting average AISCs from the average gold price yields implied unit earnings of $2,378 per ounce, representing a respectable 24.2% increase year-over-year and marking the fourth-highest level on record. This extends a remarkable thirteen-quarter streak of substantial year-over-year earnings growth for the sector.
Hard accounting results reported under regulatory standards confirmed these robust financial foundations. Collective revenues for the GDX top 25 surged 17.6% year-over-year to $34.4 billion, while bottom-line accounting profits climbed 27.9% to $11.5 billion. Operating cash flows similarly rose 21.9% to $16.5 billion, swelling cash treasuries by 28.5% to $36.9 billion and providing extensive financial firepower for future mine expansions and developments.
Combined with recent technical weakness in share prices, these consecutive quarters of strong earnings have pushed the average trailing-twelve-month price-to-earnings ratio for the GDX top 25 down to just 16.8x. This marks the second-lowest valuation multiple observed across more than a decade of research, underscoring the deep value currently embedded within the contrarian precious metals space. While potential declines in fourth-quarter gold prices and ongoing inflationary pressures may challenge near-term earnings growth comparisons, major gold miners continue to generate substantial profits while trading at valuations that fail to fully reflect their underlying financial performance.