



Wednesday delivered a fresh and turbulent round of surprises across global financial markets, highlighting a dramatic divergence between strengthening fiat currency and retreating precious metals. The U.S. dollar surged above its previous high for 2026, putting an important weekly breakout attempt squarely on the table. Gold, meanwhile, moved in a very different direction, burdened by bearish candlestick warnings and renewed downward pressure on key technical support levels.
The broader market action extended far beyond just the greenback and bullion. Silver attempted another recovery following a sharp bearish reversal earlier in the week, while platinum continued its familiar struggle against a stubborn resistance cluster. On the other side of the industrial metals complex, palladium launched an impressive bullish counterattack. Copper buyers and sellers remained locked in an intense stalemate over a technical boundary that neither side appeared willing to surrender.
The central question facing traders is whether today’s bullish attempts can survive their next encounter with heavy resistance or if the bears can finally force decisive breakdowns. Examining the specific developments across the currency and commodity markets reveals a landscape of high stakes and critical technical junctions.
U.S. Dollar (DX.F): A Breakout Across Three Time Frames?
The dollar bulls have finally delivered the kind of decisive offensive that market participants have been anticipating for sessions. Following a period of consolidation, buyers pushed the index forcefully through Monday’s bearish gap situated between 102.11 and 102.18. Furthermore, they successfully recovered the important 102.36 to 102.49 resistance combination and mounted a successful challenge against the previous 2026 high.
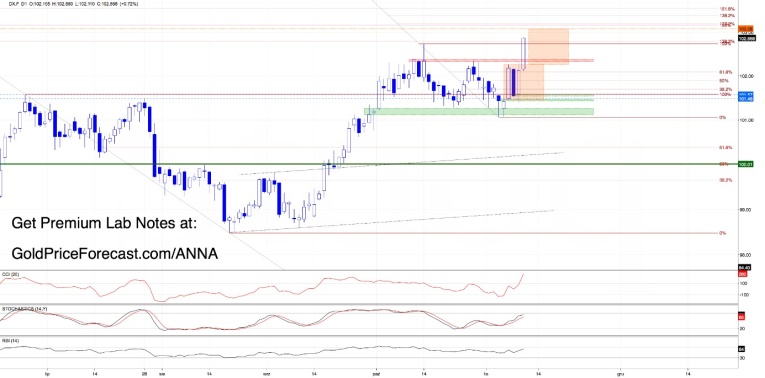
From the perspective of the daily chart, Wednesday’s advance carried the dollar well above the October 14 high at 102.73. Thanks to this robust price action, the index also pushed above two major Fibonacci levels that serve as critical reference points for market participants. Additionally, the dollar benefited from another fundamental bullish development: a clean breakout above the upper line of the orange consolidation zone, which spans from 101.44 to 102.26.
This confluence of technical milestones carries significant weight for market momentum. A daily close above 102.73 would confirm a meaningful breakthrough, substantially strengthening the case for additional gains. In practical terms, if buyers successfully confirm this breakout above the previous peak, the height of the orange consolidation pattern points toward a minimum upside target near 103.08. Beyond that immediate milestone, two Fibonacci extensions—specifically the 127.2% and 150% levels—establish the next formidable resistance area at 103.17 to 103.20.
W1: Will This Breakout Finally Hold?
Looking at the weekly chart, buyers are simultaneously attempting to overcome the upper boundary of a rising wedge formation. This could represent a considerably more important technical development than Wednesday’s impressive daily rally alone. However, market participants have strong reasons to exercise caution.
A nearly identical breakout attempt occurred around mid-October, and buyers ultimately failed to maintain those gains, resulting in a false dawn for the currency. Moreover, negative divergences flashing on the weekly Stochastic and Commodity Channel Index (CCI) indicators serve as a warning that underlying momentum has not been strengthening as convincingly as the raw price action might suggest.
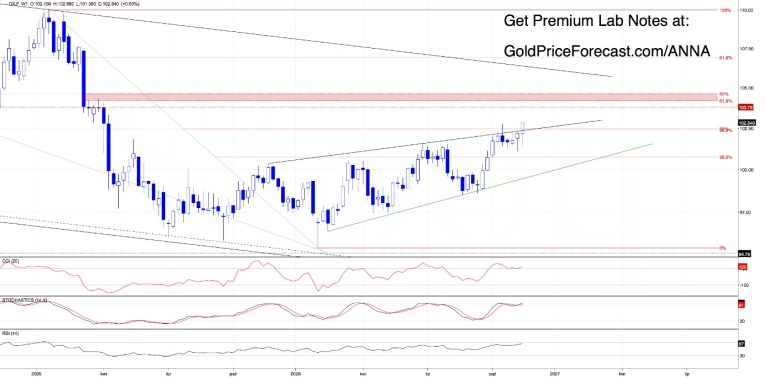
While the index is currently trading above the wedge’s upper boundary, a confirmed weekly close is still strictly required to validate the breakout. If the index experiences a late-week reversal and returns inside the formation by Friday, it would raise serious concerns about another failed attempt and potentially invite aggressive profit-taking.
M1: The Most Important Resistance Is Still Ahead
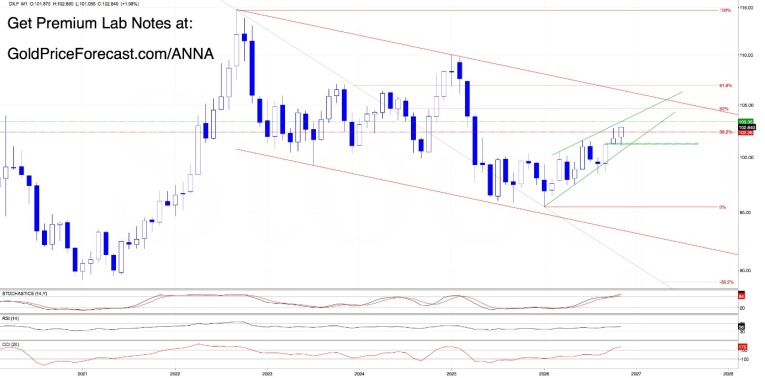
The monthly chart adds the final, and perhaps most critical, piece of the broader technical puzzle. The dollar is currently advancing steadily toward the upper boundary of its green rising wedge, which is situated near 103.35. Combined with an additional Fibonacci extension identified on the daily chart at 103.39, these levels establish a powerful 103.35 to 103.39 resistance zone. This cluster could prove to be the single most important obstacle in the dollar’s longer-term structure.
Reaching that specific target area will constitute a major test for buyers, even if the daily and weekly breakouts are successfully confirmed. Because this obstacle stems from a monthly formation, any decisive breakout or rejection will ultimately require careful evaluation in the context of the November monthly close.
Several distinct warning signals must be monitored closely to gauge the durability of the current rally. A daily close sliding back below 102.73 would immediately invalidate the breakout above the previous 2026 high. While that outcome would not necessarily destroy the broader breakout from the orange consolidation zone, a subsequent drop back below 102.26 would place that pattern at severe risk as well. Furthermore, a weekly close back inside the black rising wedge would represent a much more serious warning for bullish traders. Meanwhile, the daily CCI has surged to approximately +260, highlighting exceptional short-term momentum while simultaneously suggesting that a pullback or profit-taking wave could materialize near overhead resistance.
Gold (GC.F): Two Bearish Engulfing Formations Put Bulls on Notice
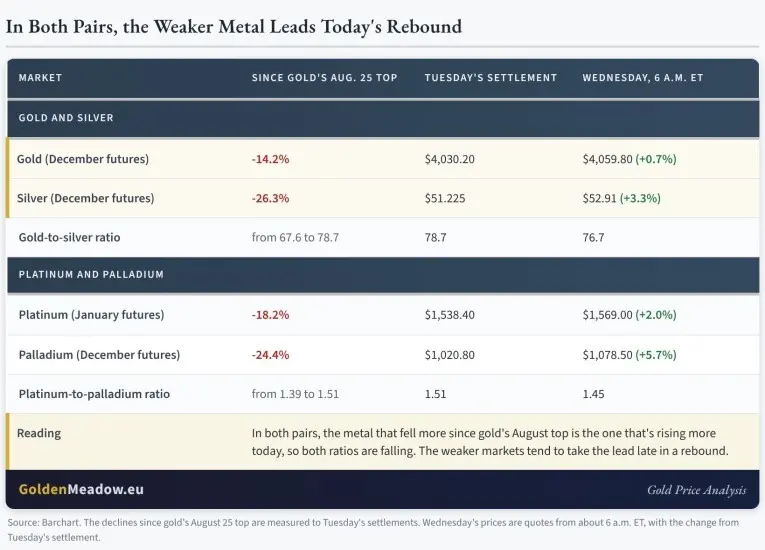
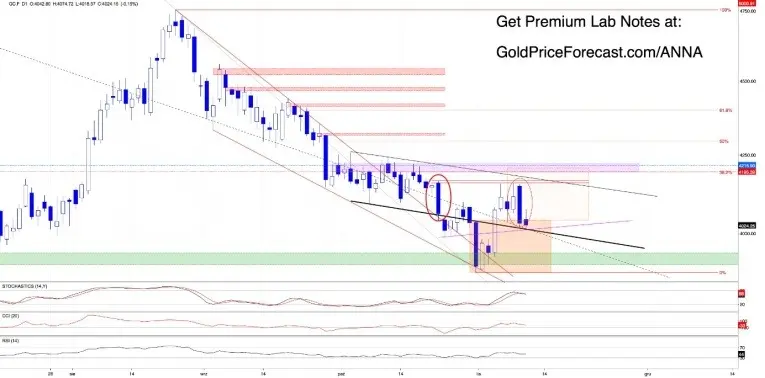
In stark contrast to the strength displayed by the U.S. dollar, gold’s buyers are rapidly running out of convincing technical arguments. Tuesday delivered yet another bearish engulfing candlestick formation, compounding the earlier warnings generated by an October 22 bearish engulfing pattern. This latest surge in selling pressure has successfully pushed gold back below the upper boundary of the orange consolidation zone near 4038, severely undermining the bullish narrative built around its earlier breakout attempts.
Wednesday failed to bring a convincing recovery to the precious metal. Despite an intraday attempt to rebound, the yellow metal struggled mightily to hold above the 4038 threshold, keeping persistent bearish pressure firmly in focus. To compound these woes, the daily Stochastic indicator generated an entirely new sell signal. When combined with the two preceding bearish engulfing formations, these indicators form an uncomfortable collection of warnings for anyone holding long positions.
Beneath the surface price action, the technical situation on the weekly chart is approaching a critical juncture. Gold is now openly threatening both the lower boundary of the daily black declining channel and the crucial psychological 4000 barrier. If sellers succeed in confirming a breakdown through these immediate supports, market attention will inevitably shift toward a far more consequential long-term level.
The weekly chart reveals that the primary long-term rising green support line currently resides near the 3955 to 3960 range. This is not merely another arbitrary short-term price reference; it represents a foundational pillar of the broader bullish market structure. Consequently, a test of that specific trendline would carry vastly greater significance than an ordinary daily pullback.
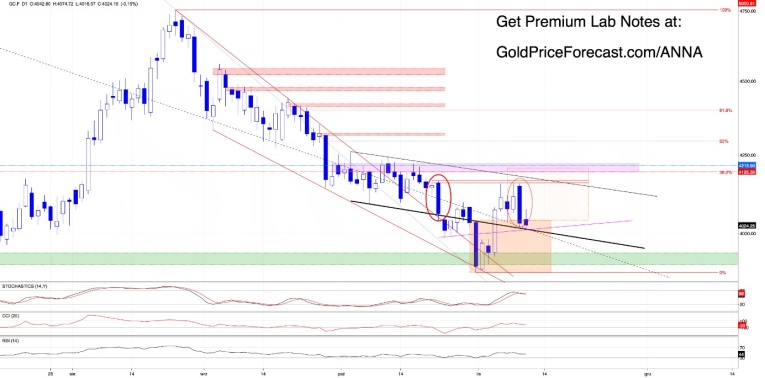
For the bullish outlook to recover any credibility, overcoming immediate resistance is only a preliminary step. Recovering the 4038 level would represent a useful initial move, but it would fall far short of erasing the damage inflicted by the recent bearish warnings. Market analysts suggest that gold would need to overcome the 4159 to 4164 range on a daily closing basis before traders could treat the multiple bearish engulfing formations as meaningfully invalidated. Until such a recovery takes place, any intermittent rallies remain highly vulnerable to renewed selling pressure.
The broader macroeconomic environment also introduces external headwinds. The dollar’s aggressive breakout attempt adds another layer of pressure, particularly if the currency index successfully hits its stated upside targets. While the historical inverse relationship between the dollar and gold is not entirely automatic, it significantly raises the stakes for traders watching both asset classes simultaneously.
Broader Metals and Market Conclusion
Beyond the primary movements in the dollar and gold, four other key metal markets are rapidly approaching decisive technical turning points. Silver opened with a fresh bullish gap and staged an intraday recovery, but buyers once again struggled to maintain their advance above important resistance lines, leaving Tuesday’s bearish engulfing pattern casting a heavy shadow. Platinum encountered the exact same formidable resistance combination for a third consecutive session, and without a breakthrough, downside risks remain prominent. Palladium managed a serious attack on its overlapping bearish gaps, moving above both intraday, though market watchers await the closing bell for confirmation. Finally, copper continued its persistent battle around the lower boundary of a declining channel, where a fresh bullish gap has aided buyers in engineering another tentative recovery.
These developments underscore a fundamental truth of technical analysis: the rapid speed with which an apparently convincing market move can lose its overall significance. A breakout may look exceptionally impressive during intraday trading, only to evaporate entirely before the closing bell rings. Conversely, a bearish reversal can appear decisive until aggressive buyers step back in to reclaim lost ground. Wednesday brought a series of promising attempts alongside serious warnings, and upcoming closing prices will ultimately determine which side prevails.