




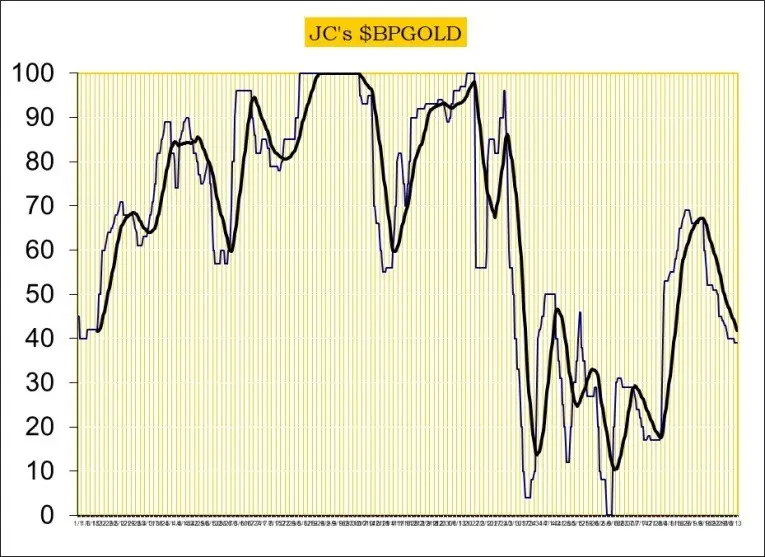
As financial markets navigate an era of heightened volatility and macroeconomic crosscurrents, technical analysts and market editors are closely examining the latest signals from the precious metals sector. According to proprietary cycle indicators utilized by market strategists, the broader cycle for gold and gold equities has officially flashed a downward signal. While short-term market dynamics are prone to periodic whipsaws during periods of intense volatility, these cyclical indicators continue to serve as critical navigational tools for traders and investors trying to decipher the underlying direction of speculative capital.

The latest technical updates point toward a clear bifurcation in strategy depending on market participation styles. For investors with a longer-term horizon, current market conditions dictate a defensive posture, suggesting that capital should either remain in cash or be adequately hedged against potential downward pressure. Conversely, active traders operating on shorter timeframes are advised to adhere strictly to disciplined cycle mechanics, entering the market near established cycle bottoms and locking in profits as prices approach cycle tops.

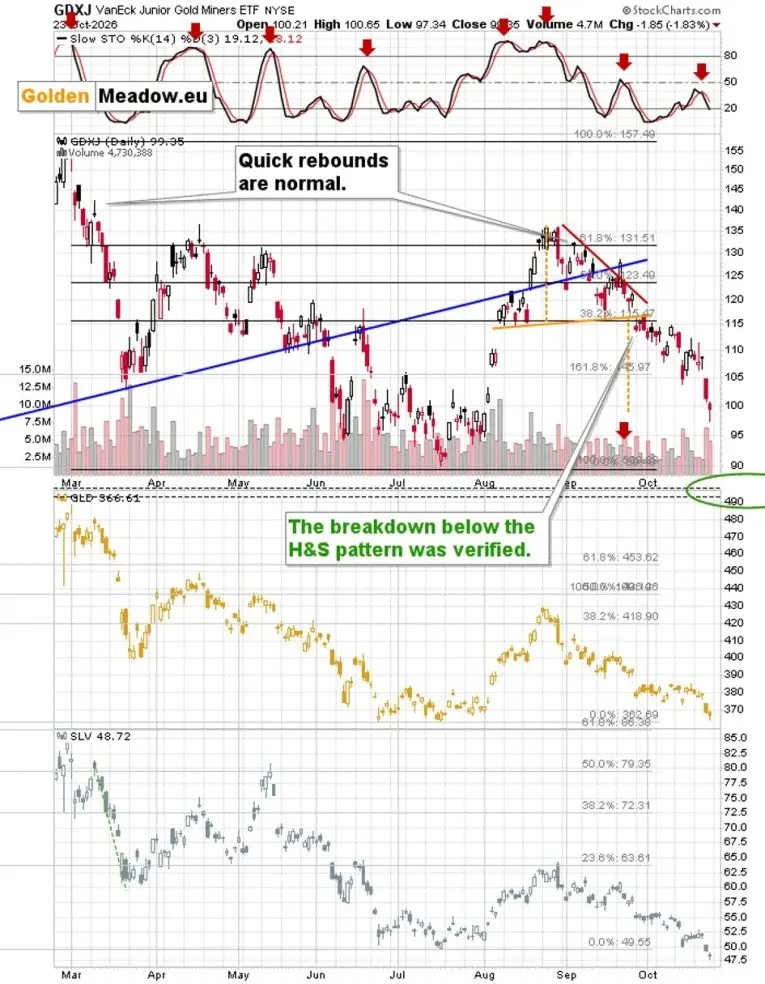
A closer examination of key exchange-traded funds and major regional indices underscores this shifting technical landscape. Several widely tracked instruments across the precious metals space have recently registered short-term sell signals. This includes the SPDR Gold Shares (GLD), which tracks the physical price of gold, alongside major equity benchmarks such as the VanEck Gold Miners ETF (GDX) and the junior gold miners equivalent, the VanEck Junior Gold Miners ETF (GDXJ). Canadian markets are reflecting a similar technical posture, with the broader S&P/TSX Global Gold Index (XGD.to) likewise confirming a short-term sell signal across its trading charts.

These synchronized technical signals arrive amid a complex interplay of broader market trends. Technical analysis of current speculative behavior points toward an overall expectation of lower gold prices in the near term, even as overarching macro trends present a more nuanced picture. On a multi-week and multi-month basis, the broader structural trend for physical gold remains pointed upward, though prices are currently testing critical technical support levels. A similar upward structural trend has characterized gold stocks over a broader timeframe, mirroring the resilience seen in the U.S. dollar, which has maintained its upward momentum.

However, the recent recovery rally across the gold sector appears to have hit a formidable roadblock. Technical indicators reveal that gold stocks were decisively rejected at key overhead resistance levels, bringing an abrupt halt to the recent upward bounce. This rejection has paved the way for a corrective phase currently in progress across the sector. Adding to the technical complexity, specific intermarket ratios have triggered sell signals, further reinforcing the notion that the market is undergoing a necessary consolidation or retracement phase after previous gains.

Despite the prevailing short-term correction and the downward flip in the primary cycle indicator, technical observers note that structural chart patterns continue to evolve. Notably, a potential inverted head and shoulders pattern is currently in progress on the charts, a formation that technical analysts frequently monitor for clues regarding potential long-term trend reversals once the current corrective phase exhausts itself.

In summary, the current market environment for the precious metals sector is characterized by a downward cycle indicator operating against a backdrop where longer-term structural trends for both gold and gold stocks remain pointing upward, alongside a strengthening U.S. dollar. With recent recovery rallies having been successfully repelled at major resistance levels, a broader market correction is now actively underway.

Market strategists emphasize that these technical updates are generated through a systematic trading model rather than subjective forecasts or market predictions. The model is designed to deliver objective signals and setups that dictate whether market participants should position themselves long, short, or in cash at any given moment. Because real-time entry points and stop-loss levels are managed dynamically and communicated directly to subscribers, published retrospective updates may not always fully capture the exact positioning of strategists in real time. Traders and investors are consequently reminded to evaluate these insights within the context of their own personal risk management frameworks and trade at their own discretion.