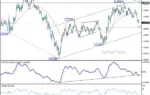

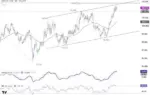



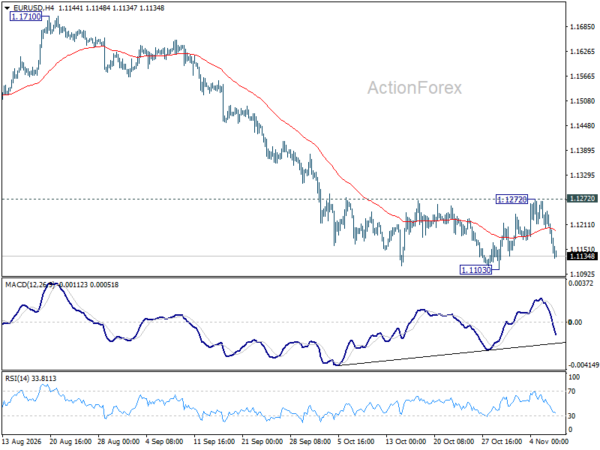
The EUR/USD currency pair remained confined to a familiar range above the 1.103 support level last week, leaving foreign exchange traders and analysts closely monitoring price action for signs of a decisive breakout. As a new week of trading gets underway, the initial bias for the world’s most heavily traded currency pair remains neutral, though underlying technical pressures suggest that a further decline could be on the horizon. Market participants are keeping a watchful eye on key technical thresholds that are expected to dictate the pair’s medium- and long-term trajectory.
Throughout the previous week’s sessions, the single currency fluctuated within a defined band, failing to muster enough momentum to break out of its recent consolidation zone. According to technical assessments, the immediate bias remains neutral, but the prevailing market dynamics indicate that further downward movement remains the more probable path in the near term. On the downside, a definitive break below the critical 1.1103 support level would invalidate the recent consolidation and extend the larger downward correction that has been unfolding from the 1.2081 medium-term top. Should this support give way, attention will quickly shift toward the 1.0904 Fibonacci retracement level as the next logical downside target for sellers.
Conversely, market participants are also monitoring alternative scenarios should buying pressure reemerge. A firm and sustained break above the 1.1272 resistance level would alter the short-term technical landscape. Such a move would signal that a short-term bottoming process has likely taken place, potentially paving the way for a stronger and more sustained rebound in the exchange rate. However, until such a breakout materializes, upside potential is expected to remain constrained.
Broader Picture Points to Extended Correction
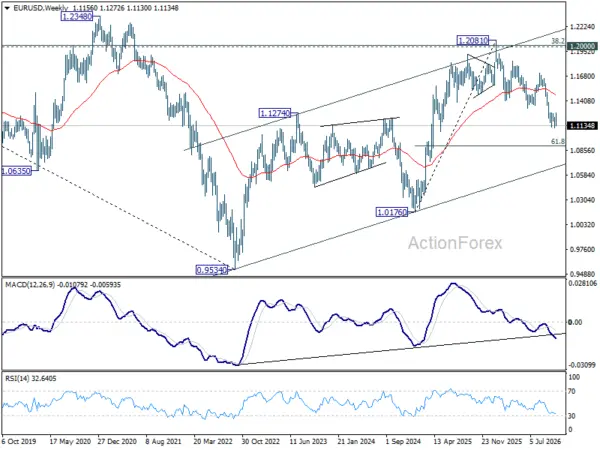
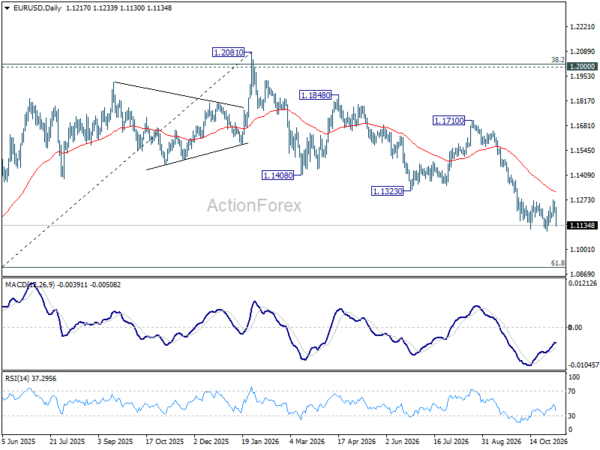
Stepping back to analyze the bigger picture, recent developments in the EUR/USD chart suggest that the pronounced fall from the 1.2081 medium-term top is actively reversing the preceding upward trend. Specifically, this downward leg appears to be retracing the significant rise that originated from the 2025 low of 1.0176, and potentially even probing deeper into the rally that began at the 2022 low of 0.9534.
As the downward pressure persists, analysts anticipate that deeper losses will materialize, with the currency pair likely heading toward the 61.8% Fibonacci retracement of the move from 1.0176 to 1.2081, which sits squarely at the 1.0904 mark. In the event of any interim relief rallies or technical rebounds, the overall risk profile will remain skewed to the downside for as long as the 1.1710 resistance ceiling remains intact. This overhead barrier serves as a crucial line in the sand for bearish traders looking to maintain control over the medium-term trend.
Long-Term Technical Focus Shifts to the 55 Month EMA
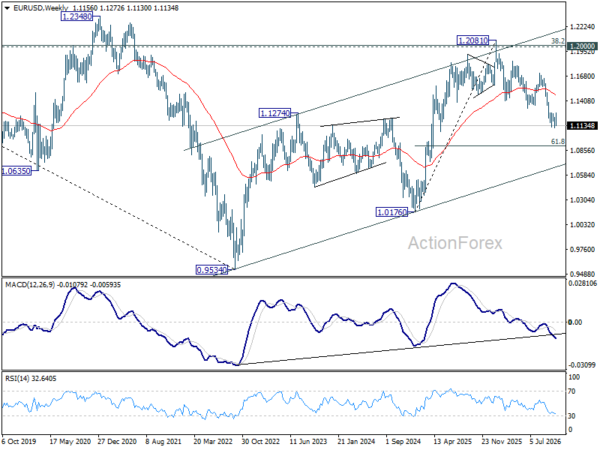
In examining the broader long-term structural outlook, immediate market focus has now zeroed in on the 55-month Exponential Moving Average (EMA), which is currently positioned at 1.243. A sustained break beneath this closely watched moving average would carry significant technical implications for the currency pair.
Specifically, a decisive violation of the 55-month EMA would argue strongly that the substantial upward recovery from the 2022 low of 0.9534 has officially reached its conclusion. Under this Elliott Wave or corrective interpretation, the rise to 1.2081 would be categorized as a completed three-wave corrective move. This corrective rally was notably halted following a rejection near the 38.2% retracement of the monumental long-term drop from the 2008 high of 1.6039 down to the 0.9534 low, a zone that converged closely with the 1.2019 level and the key 1.2000 psychological milestone.
If this scenario unfolds, it would reinforce the argument that the broader, multi-year downtrend originating from the 1.6039 peak in 2008 remains structurally intact, keeping long-term bears firmly in command of the macroeconomic narrative surrounding the euro and the US dollar.
Two Decades of Market Insights from ActionForex
As traders navigate these complex technical levels across daily, weekly, and long-term charts, comprehensive analysis continues to be provided by established industry resources like ActionForex.com. Established back in 2004, ActionForex has been serving the global forex trading community for over two decades, delivering insightful commentary and analytical tools to participants around the world.
The platform originally launched with a modest offering consisting solely of a daily report and a mid-day report, which have since evolved into the widely followed Action Insights publication. Over the years, the site has significantly expanded its in-house content offerings to support traders operating in fast-moving currency markets. The Technical Outlook section has grown to encompass a comprehensive array of currency pairs, providing granular breakdowns of price action, support and resistance zones, and overarching trend structures.
In addition to written analytical reports, ActionForex provides a suite of specialized quantitative tools utilized by traders globally. These resources include Top Movers analyses, currency heat maps, pivot point charts, pivot meters, action bias indicators, and volatility charts. By combining traditional technical analysis with modern analytical tooling, platforms of this nature continue to assist market participants in interpreting complex price movements like the ongoing consolidation and downside risks currently observed in the EUR/USD pair.